Transaction Master Summary Report
Bullhorn Support is able to assist with navigating sample reports, but they are unable to build customizations on reports for you. If you need customizations, you will need a Business Intelligence specialist who is familiar with writing database queries.
The Transaction Master Summary report provides a list of detailed pay and bill transactions that are aggregated to show one record per charge during a specified date range. Transactions originate from the time entry system (i.e. ) or are manually entered in payable or billable charges.
This is one of three similarly-named reports, which provide visibility to the same data through a different lens. The other Transaction Master Reports are:
- Transaction Master Detail: Full line-by-line report of each pay and bill transaction.
- Transaction Master Summary Exceptions Report: Uses the Transaction Master Summary report as a base, and applies various exceptions parameters to the aggregate hours for the week.
| Data item in report | Definition |
|---|---|
| Amount | Quantity * Rate |
| Bill Item | Represents revenue category for the charge that is linked to a GL account; Determined from the related earn code's bill item field |
| Bill Master ID | ID of Billmaster from relevant pay/bill details |
| Bill Master Transaction ID | From relevant pay/bill details |
| Bill Status | Billable Charge status |
| Bill or Pay ID | Billable or Payable Charge internal system ID (1 bill or pay ID can consist of multiple bill or pay master IDs) |
| Bill or Pay Master ID | Billable or Payable Master internal system ID (multiple pay or bill master IDs roll up to a single bill or pay ID) |
| Bill-to Client | The name of the client who receives the invoices |
| Bill Unit | |
| (Billable Charge) Description | Title of charge |
| Billable Charge Earn Code | Code that defines the transaction by Time, Amount, or Unit: Reg, OT, DT, Expenses, tests, etc. |
| Billable Charge ID | |
| Billable Amount | Billable charge total bill |
| Billable Hours | Billable charge measure of time |
| Billable Profile ID | From the billing profile on the related company |
| Billable Rate | Billable charge rate |
| Billing Period End Date | Period end date of the transaction |
| Candidate ID | Candidate's internal system ID |
| Candidate Name | Candidate's name |
| Class | General category to describe the placement's empl type (i.e empl type = contract, then it's consultant hourly). Depending on the transaction, it's determined from the charge, placement or related earn code. |
| Client | The client's name |
| Currency | The currency the transaction amount is in |
| Earn Code | Code that defines the transaction by Time, Amount, or Unit: Reg, OT, DT, Expenses, tests, etc. |
| Employment | Employee placement type: direct hire, contract, contract to hire |
| Employee Type | Employee hiring status: W2, IC, etc. |
| GL Segment 1 | Accounting ownership value from billable/payable charge; if blank, then from the placement |
| GL Segment Name 1 | Accounting ownership description from billable/payable charge; if blank, then from the placement |
| GL Segment 2 | Accounting ownership value from billable/payable charge; if blank, then from the placement |
| GL Segment Name 2 | Accounting ownership description from billable/payable charge; if blank, then from the placement |
| GL Segment 3 | Accounting ownership value from billable/payable charge; if blank, then from the placement |
| GL Segment Name 3 | Accounting ownership description from billable/payable charge; if blank, then from the placement |
| GL Segment 4 | Accounting ownership value from billable/payable charge; if blank, then from the placement |
| GL Segment Name 4 | Accounting ownership description from billable/payable charge; if blank, then from the placement |
| GL Segment 5 | Accounting ownership value from billable/payable charge; if blank, then from the placement |
| GL Segment Name 5 | Accounting ownership description from billable/payable charge; if blank, then from the placement |
| Invoice | ID auto-assigned when the invoice is finalized. This is the ID used to pass onto the client and accounts receivable for reference. |
| Invoice Date | Date assigned when the invoice is finalized. This will be the date to use in the calculation for payment terms. |
| Invoice Status | What stage the invoice is in. Statuses are New, Ready, Hold, Finalized. |
| Job Posting ID | Job posting's internal system ID |
| Job Title | Job posting's title |
| Pay Amount | Payable charge total pay |
| Pay Hours | Payable charge measure of time |
| Pay Master ID | |
| Pay Rate | Payable charge rate |
| Pay Status | Payable charge status |
| Pay Unit | Measure of payable charge |
| Payable Charge | Charge Id |
| (Payable Charge) Description | Title of charge |
| Payable charge from earn code | From payable charge information |
| Placement ID | Placement's internal system ID |
| Period End Date | Last date in period when the transaction occurred |
| Pre-Invoice ID | Internal system ID auto-assigned when the invoice is created |
| Quantity | Amount or number of the transaction |
| Rate | Pay or bill rate of the transaction |
| Recording Date | Date the transaction was recorded |
| Status | Bill or pay transaction current state: not ready to pay or bill, ready to pay or bill, invoicing, invoiced, processing, exported, etc. |
| Transaction Date | Date the transaction occurred |
| Transaction Origin | Creation point: PeopleNet, Timesheet, Expense Report, Billing Event, Revenue Event from BillMaster or PayMaster |
| Transaction Source | Bill or Pay transaction |
| Transaction Status | Time entry status: submitted, approved, etc. |
| Transaction Type | Transaction purpose: Billable, Payable, Burden, Standard Cost, Discount, Rebates, etc. |
| Unit | Unit of Measure (i.e. hours, days, miles, etc) |
Use Cases
There are multiple scenarios where the Transaction Master Summary Report can be utilized. A few recommendations for use include:
-
High Level Visibility to Pay Bill Data: Management often wants to view Pay Bill data at a high level, rather than the details at a transaction level.
-
Validation Tool: This report can be used as a “smoke test” by the Payroll and Billing Specialists to validate totals, especially against numbers that were manually entered.
-
Research Tool: Occasionally research is needed against Pay or Bill data. This report can more quickly assist with research to identify issues or gaps. Once areas are identified, the Detail Report can be run to view specific details.
-
Reconciliation Tool: When conducting a reconciliation, this report can be utilized to “tick and tie” totals quicker and easier than using the Detail Report.
-
Trending by Department/Branch: By running two reports for a different time period, comparing the results can identify trends, areas needing improvement, issues, or areas of success. For example, comparing pay and bill by the following earn codes, Holiday, PTO, Sick, or Per Diem across months or quarters.
-
Client Reporting: Sales may want to provide client billable data broken down by earn code, in an effort to consult with clients regarding trends or solutioning for client concerns. For example, if the client’s OT hours are increasing, the salesperson may consult with the client regarding adding resources as a cost savings measure to avoid paying higher OT bill rates.
-
HR/Finance: some Agencies provide employer paid (not billable ) holiday pay, PTO, sick pay. The report could be leveraged by the Finance Department to identify trends in usage/payouts and forecast potential financial impacts based on the trends. In addition, HR can leverage the Summary Report to ensure compliance for state laws around Sick Pay.
See Sample Transaction Master Summary Report to view an example of this report in action.
Running the Report
Run this report weekly after billing processes are completed as a quick data validation. If additional detail is needed, the Payroll and Billing Specialists would run the Transaction Master Detail Report.
-
From your Bullhorn ATS Menu, select Canvas.
-
Select Run beside the Transaction Master Summary Report.
-
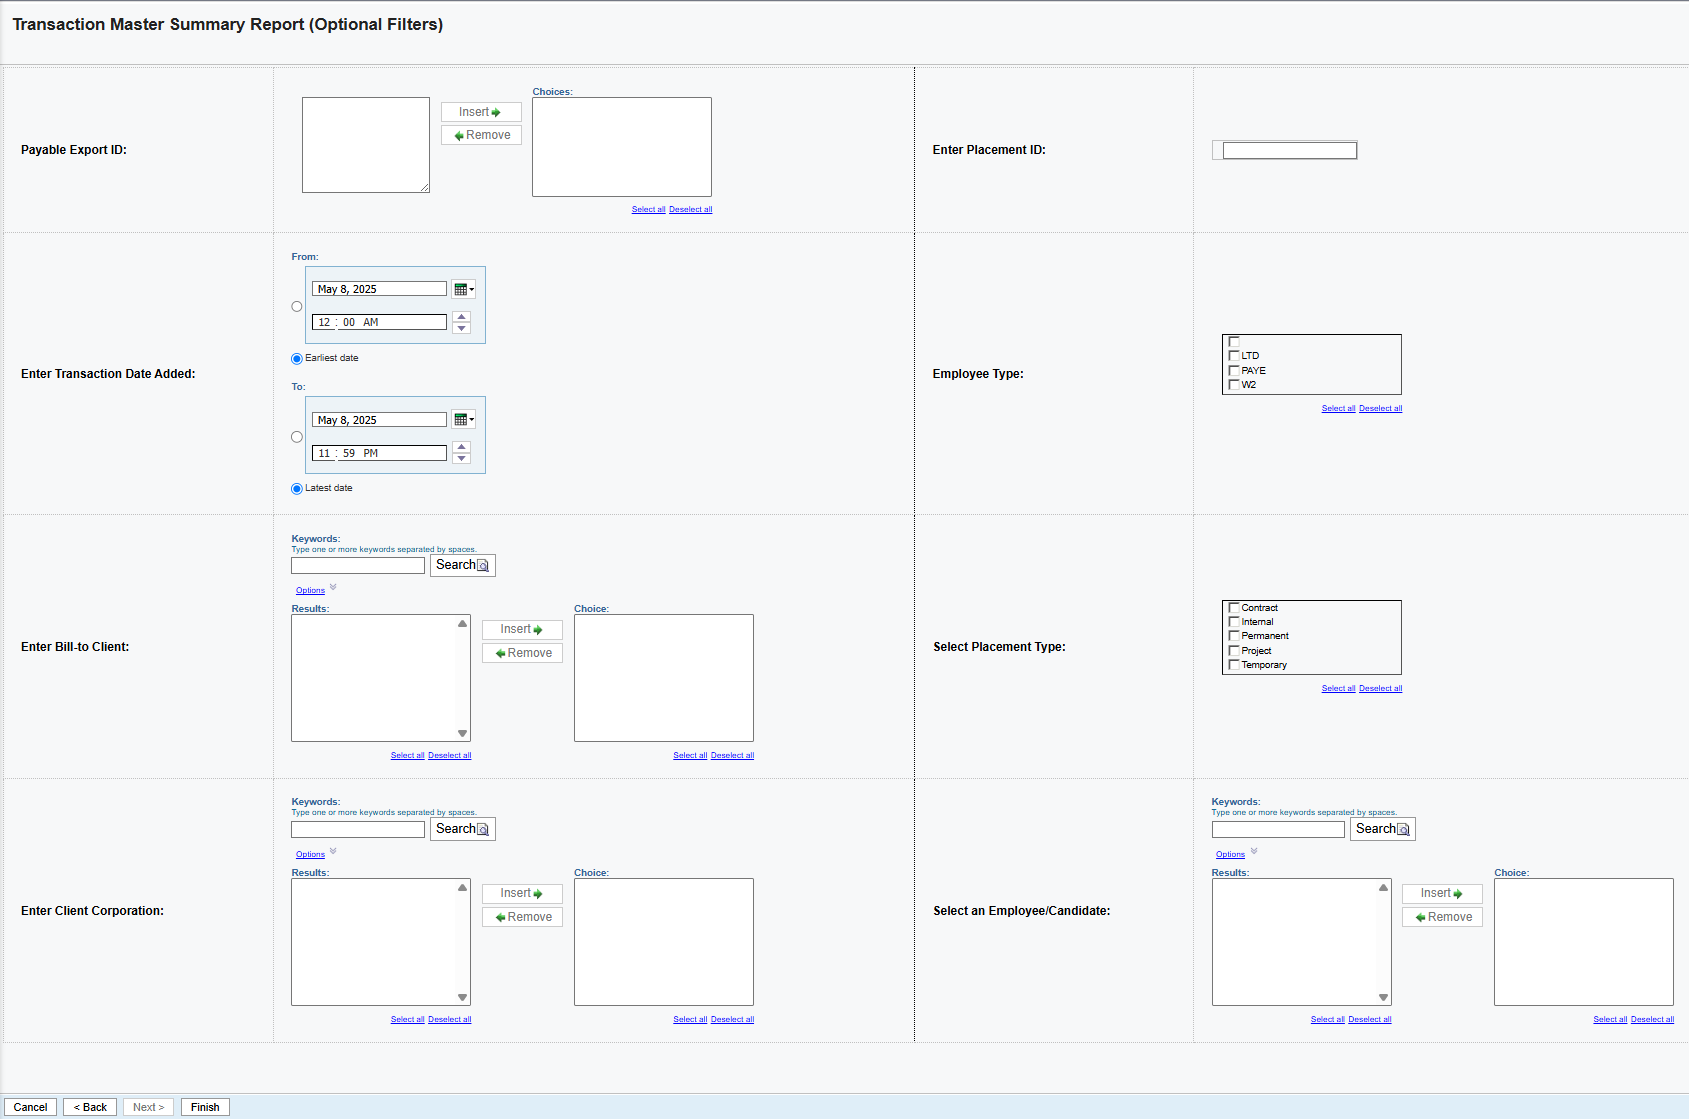
Enter the Period End Date Range. This is the only required criteria.
-
Click Next.
-
Add any additional Filters to return a more specified list. These settings are all optional.
-
Click Finish.
Exporting to Excel
Depending on the amount of data, it may be easier to view the report via Excel. Follow these steps to export your report to Excel:
-
From the HTML drop down button in the top right corner, click View in Excel Options > View in Excel 2007 Format.
The Excel format you choose can be based on personal preference. We recommend using View in Excel 2007 Format to maintain the same format that you see in Bullhorn Reporting (Canvas) and/or if you plan to use standard Excel functions (pivot, sort, etc).
-
The request will process and a pop up stating "Your report is ready and will download to your Web browser in a few moments" will appear.
-
When prompted, Save the report to your computer.
Once the report is exported to Excel, you can utilize standard Excel functions to filter, sort and pivot the data.