Analytics Overview
Overview
enables you to build Reports and Dashboards that will help you to analyze your Job and Placement results. It makes it easy to visualize and analyze your work using customizable Reports and Dashboards. This article details out the report and dashboard.
Basic Terminology
|
Term |
Description |
|---|---|
|
Reports |
A list of records that meet the criteria you define. Displayed in rows and columns, and can be filtered, grouped, or displayed in a graphical chart. |
|
Report Type |
Defines the set of records and fields available on a Report. |
|
Report Builder |
A drag-and-drop interface for creating and modifying Reports. |
|
Dashboards |
A visual representation of data from multiple Reports. |
|
Dynamic Dashboard |
Runs using the security settings of the user viewing the dashboard. Each user sees the dashboard according to his or her own access level. This approach helps administrators share one common set of dashboard components to users with different levels of access. |
|
Dashboard Builder |
A drag-and-drop interface for creating and modifying dashboards. |
Introduction to Reports and Dashboards
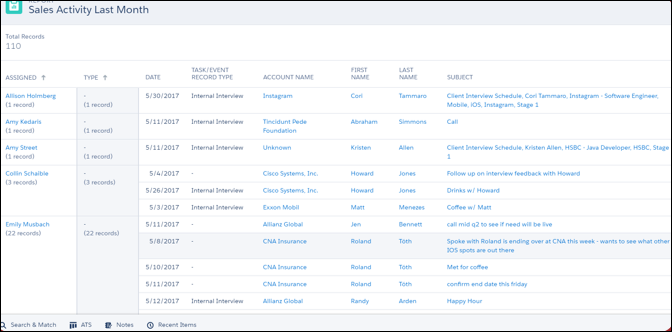
A Report is a compilation of data from one or multiple objects, such as Accounts and Contacts, that contains real-time information. Reports are customizable so users can add & remove fields and create filters. They can also be exported to Microsoft Excel.
A Dashboard is a visual representation of a Report or collections of Reports. Dashboards provide instant access to key business metrics. You can use Dashboards to gain visibility into your day-to-day operations.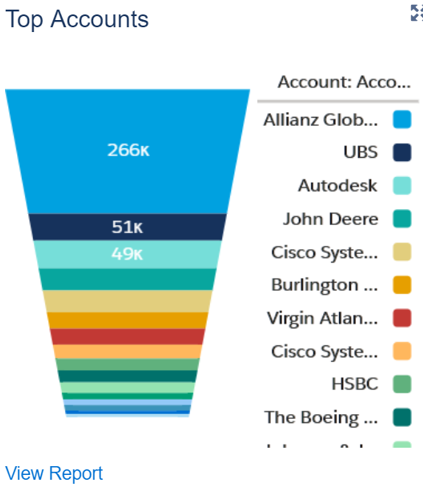
Reports
- Navigate to the App Launcher > Front Office app.
- Select the Reports tab.
- If you don't see the Reports Tab, click the More drop-down and then select
Reports.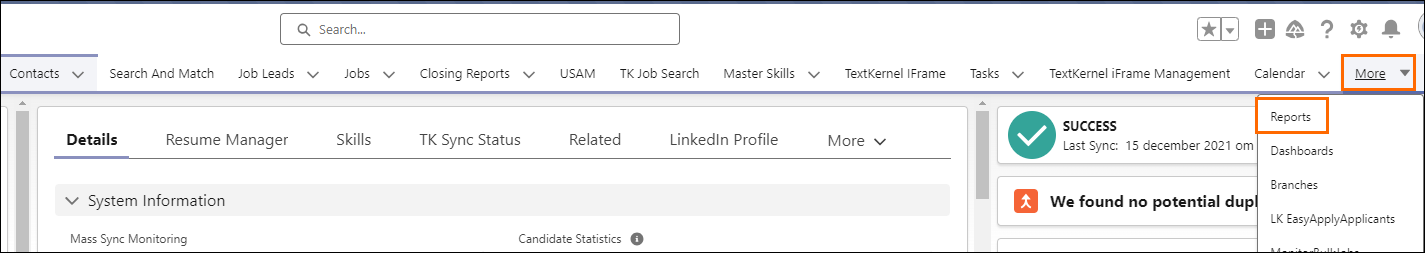
- If you don't see the Reports Tab, click the More drop-down and then select
Every Report is stored in a folder. Folders can be public, hidden, or shared, and can be set to read-only or read/write. You can control who has access to your folder. It is possible to make a folder available to your entire organization or make it private so that only the owner has access.
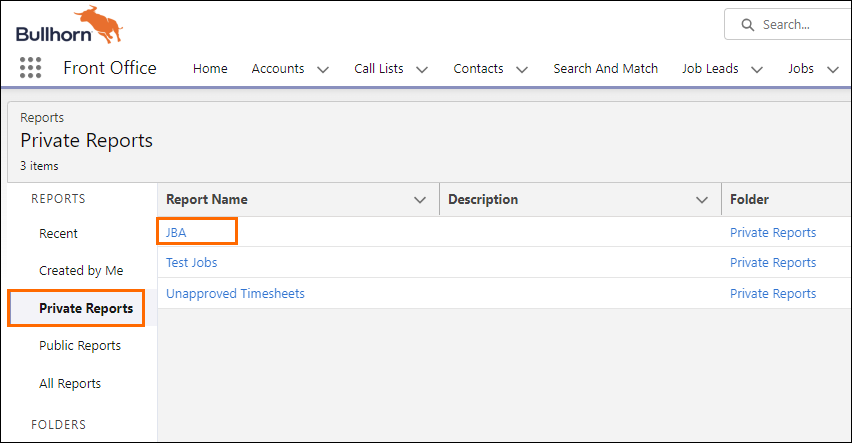
Reports Home Page
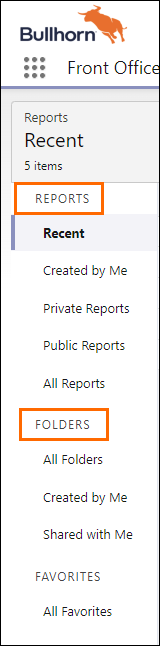
The left side of Reports contains all folders and Reports that you have access to.
All standard Reports can be used as a starting point for customized Reports. It is not possible to create Dashboards out of a standard Report.
Reports provides default access to the following folders:
- Private Reports: Customized Reports that have been created and saved by you.
- Public Reports: Created by the administrator to share custom Reports.
Your can customize the visibility of the Report folders.
Opening a Report
- Select the Report to run.
- Choose the desired Report Name.
When you select a Report Name to open, the Report will be run based on current real time data. It will also only show data you have access to.