Dashboards - Lightning
Dashboards Overview
Dashboards show data from source Reports as visual components, which can be charts, gauges, tables, metrics, or Visualforce pages. They help you visually understand changing business conditions, so you can make decisions based on the real-time data you have gathered with reports. Use dashboards to help you identify trends, sort out quantities, and measure the impact of your activities.
Build a Lightning Dashboard
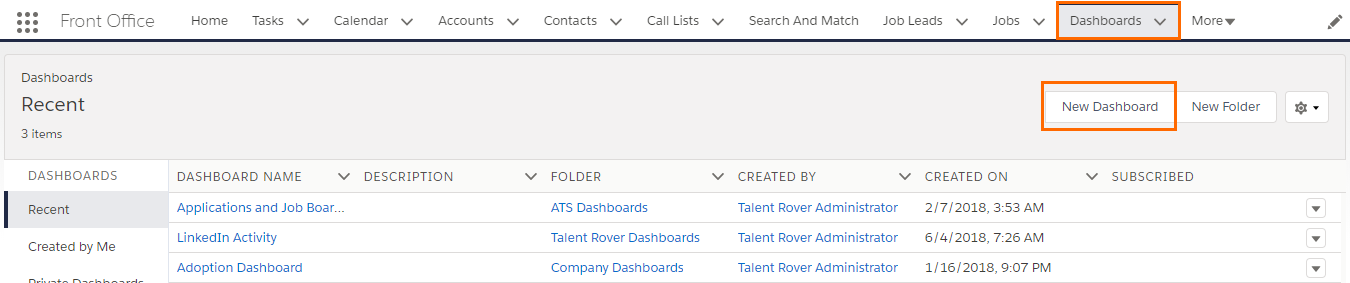
- Navigate to the Dashboards tab.
- Go to New Dashboard.
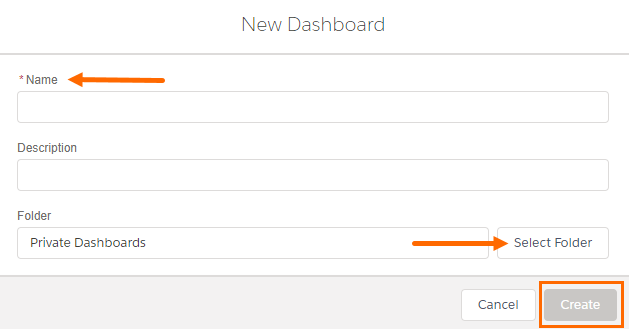
- Name the dashboard.
- Provide a short Description.
- Click Select Folder and place the dashboard in a Folder. Private Dashboards is the default folder.
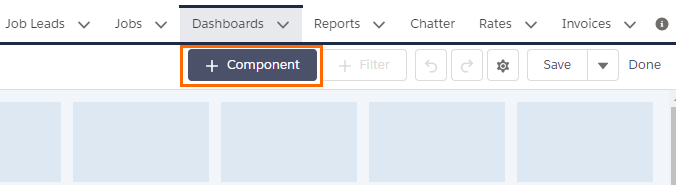
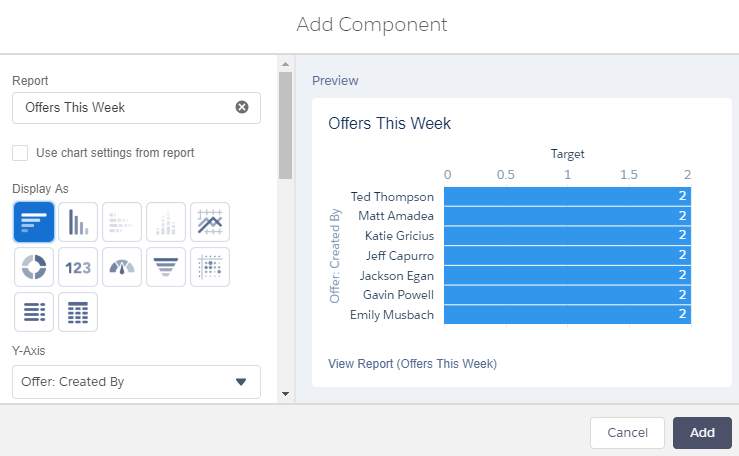
Add or Edit a Component
- Select + Component.
- Choose a source report for the component, then Select.
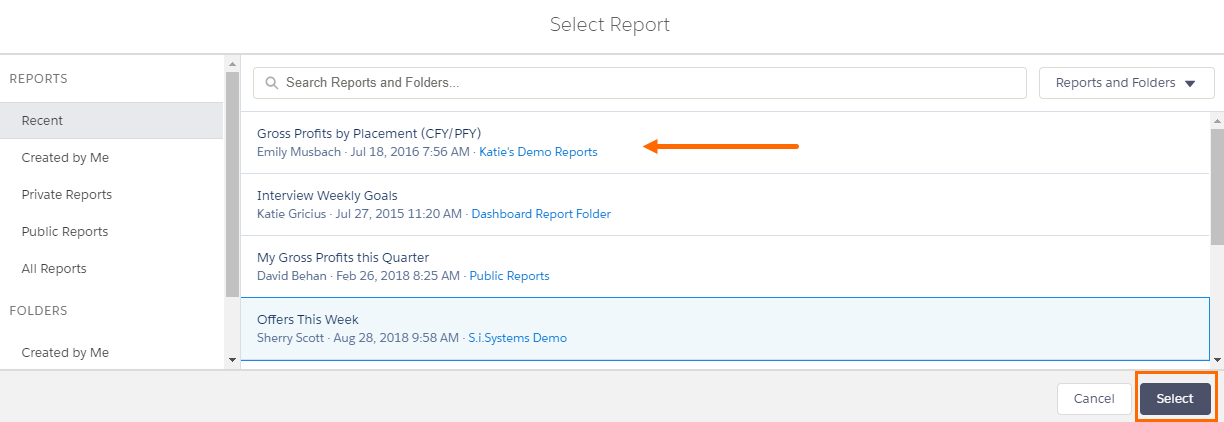
-
Customize how the component displays data, then Add.
-
Arrange and resize the component as necessary.
-
- To edit an existing component, click the pencil
 .
. - To remove a component, click the
 icon.
icon.
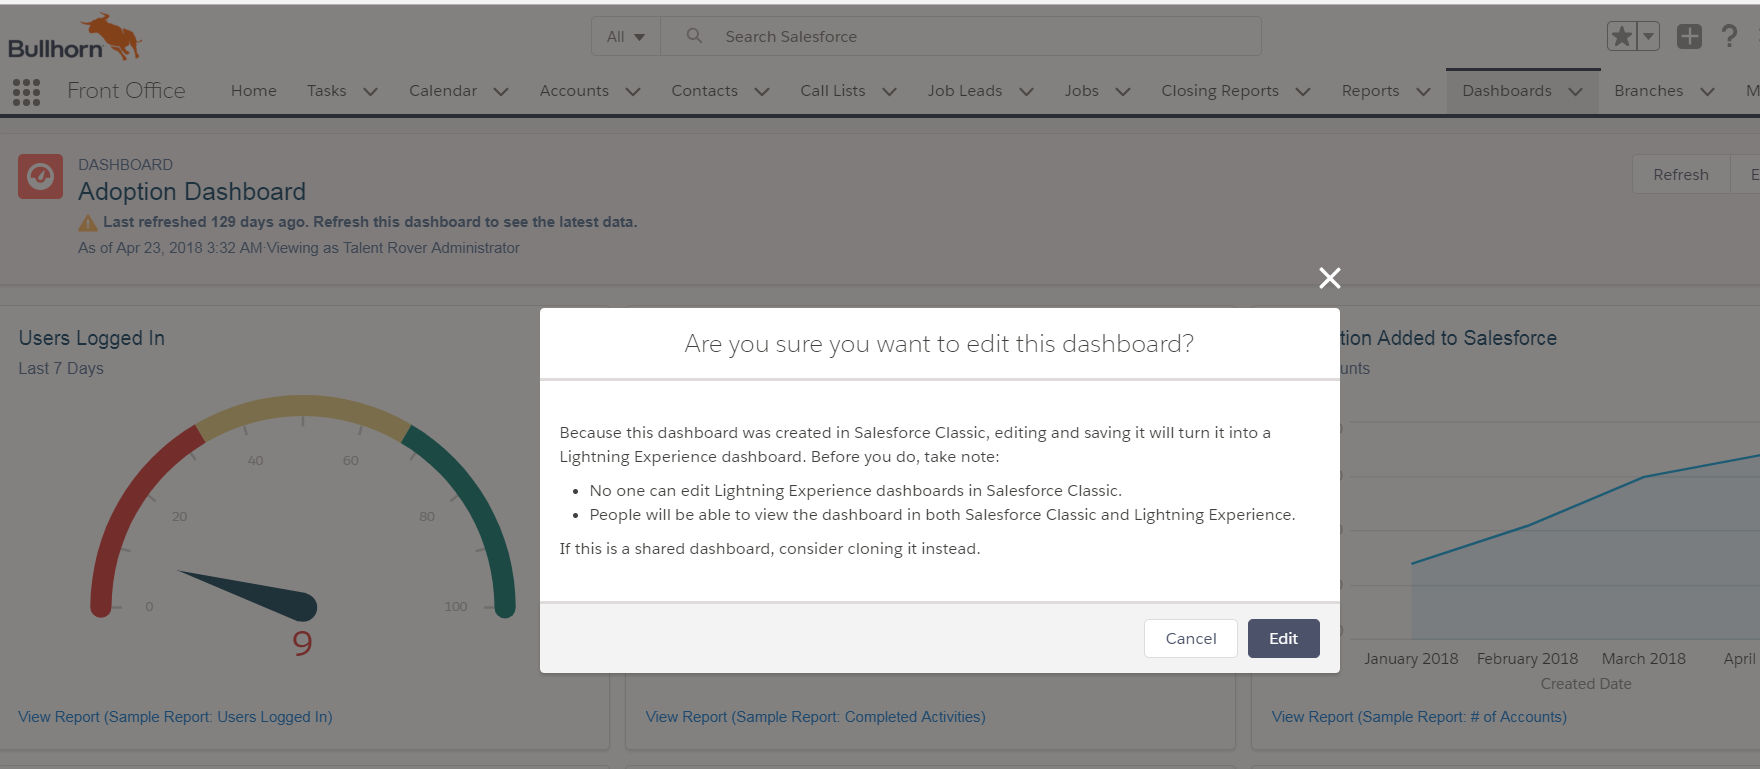
Limitations
There are limitations when editing Dashboards in Lighting that are created in Classic.
One of the following popup messages will display when you have reached a dashboard limitation:
- No one can edit Lightning Experience dashboards in Salesforce Classic.
- People will be able to view the dashboard in both Salesforce Classic and Lightning Experience
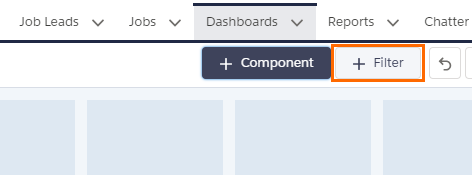
-
Select + Filter.
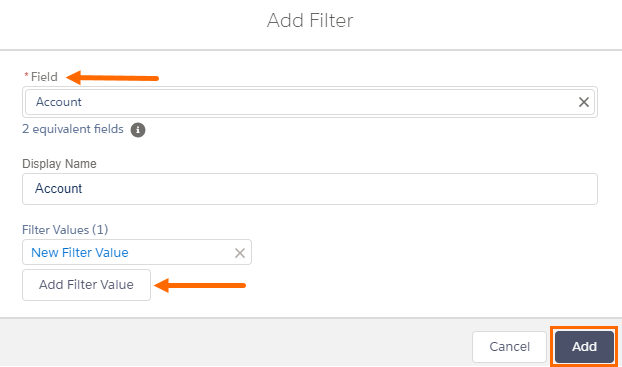
-
From the Field drop-down, choose a field to filter on.
Note: The drop-down shows fields that can be used to filter all the dashboard’s components. If there are equivalent fields for your selection, hover over the
 icon to see them.
 -
Type a Display Name to identify the filter. If the filter has many equivalent fields, consider using a name that works for all components.
-
Add Filter Value to assign values to the filter.
-
Select Add.
Properties
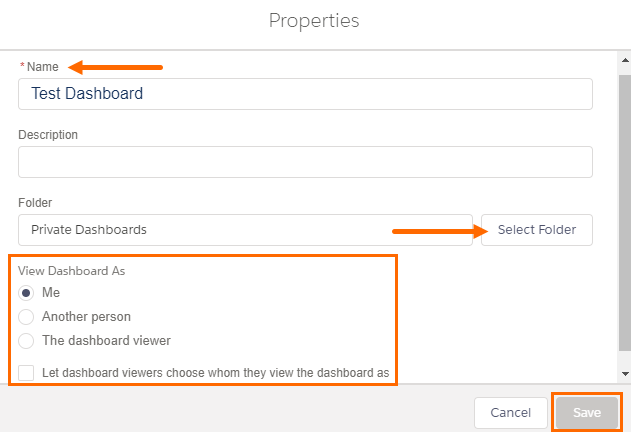
To specify who people view the dashboard as, click the gear icon to open the Properties menu.
- Type the Name to rename the dashboard. (optional)
- Type the Description to describe the dashboard. (optional)
- Select Folder to move the dashboard into another folder. To switch folders, first click the X icon, then select another folder.
-
Under View Dashboard As, choose who people view the dashboard (and all source reports) as.
-
Me: People view the dashboard as you.
-
Another person: People view the dashboard as whomever you choose.
-
The dashboard viewer: People see data as themselves, according to their own access to data.
-
Let dashboard viewers choose whom they view the dashboard as (optional): Enable a reader with appropriate user permissions to choose who they view the dashboard as.
-
- Click Save.
Once you complete your dashboard build, select Done.
You can delete your dashboard by clicking the Save dropdown and select Delete.