Build a Report - Lightning
Overview
Reports give you access to your data. You can examine your data in almost limitless combinations, display it in easy-to-understand formats, and share the resulting insights with others.
Reports basics include:
Build a Report
Lightning report builder is a powerful and intuitive tool for analyzing your data. Group, filter, and summarize records to answer business questions like “What is the total number of Job Offers this week?” For a visual overview of your data, add a report chart. When finished, run your report to see full results.
If you have access to both the Lightning report builder and the Classic report builder, then you can open the Classic report builder by clicking New Report ( Classic).
Steps
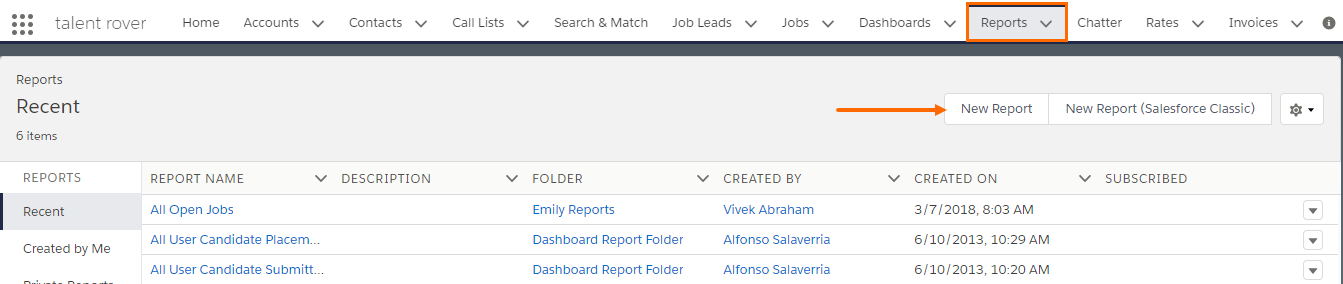
- Navigate to the Reports tab.
- Go to New Report.
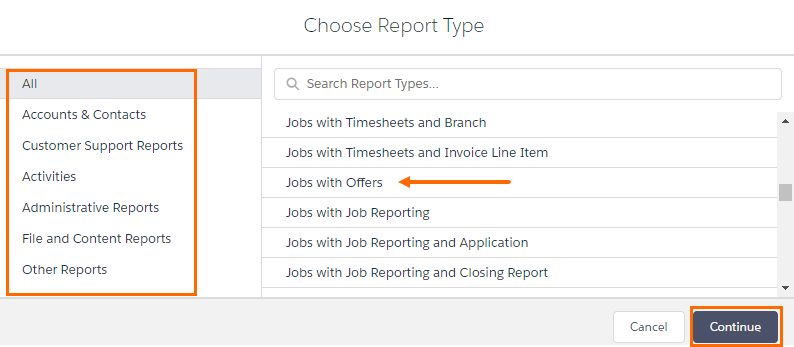
- Choose a Reports Type.
- The report type you choose determines which records are returned and which fields are available in your report.
- Select Continue/Start Report.
- The report opens and shows a preview.
Report Buttons
|
|
Toggle Chart: Change chart view and display. |
|
|
Filter: Filter records from your report. |
|
|
Refresh: Refresh any updates to the report. |
|
|
Settings: Remove and replace rows shown. |


Editing a Report
To begin, click the Edit button.
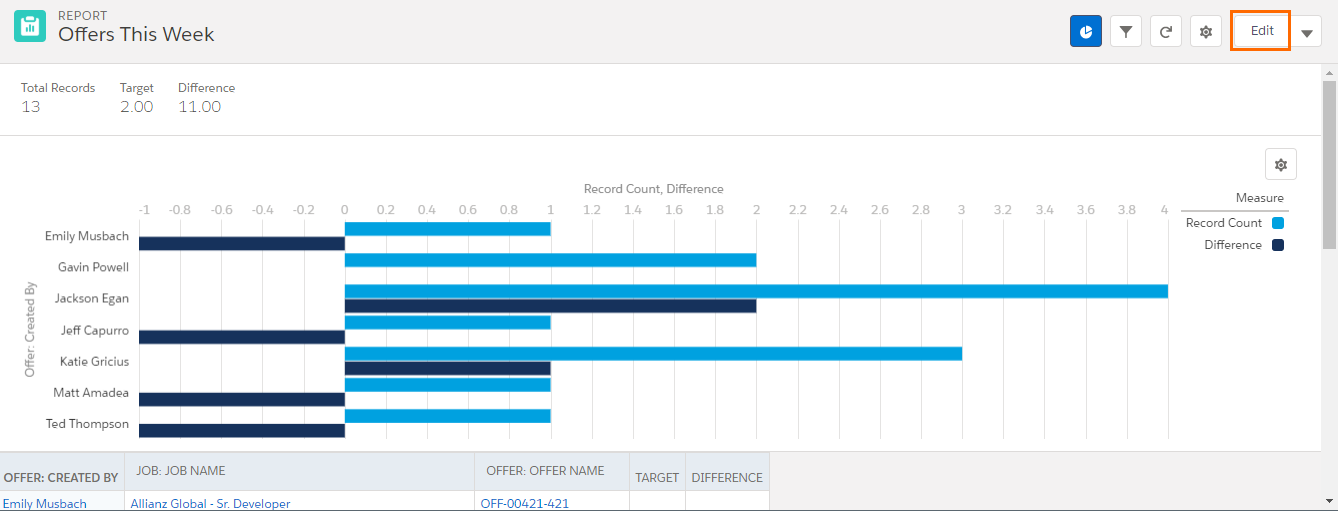
In edit mode, add and remove fields to your report as columns, group rows and columns, filter report data, and show or hide a chart. Customize your report until it shows exactly the data that you need.
- Outline: Add and remove fields to your report, as Columns, Group Rows and Columns. Filters: Filter records from your report.
- Toggle Chart: Show or hide chart
- Save & Run: Save & Run to view the report
- Save: Save report. Save options also include:
- Save As - If you’re creating a brand-new report, give it a name. Optionally, give it a description. With access and sharing in mind, save the report in an appropriate folder, so you can share it with your team.
- Properties
- Close: Close edit mode report
- Run: View complete row results
- Chart Properties: Display as Bar, Column, Line, etc., attributes and Remove chart.
- To add chart, click the
 Add Chart icon.
- To add chart, click the
- Row Counts: Show or hide row counts
- Detail Rows: Show or hide detail rows
- Subtotals: Show or hide subtotals
- Grand Total: Show or hide the grand total
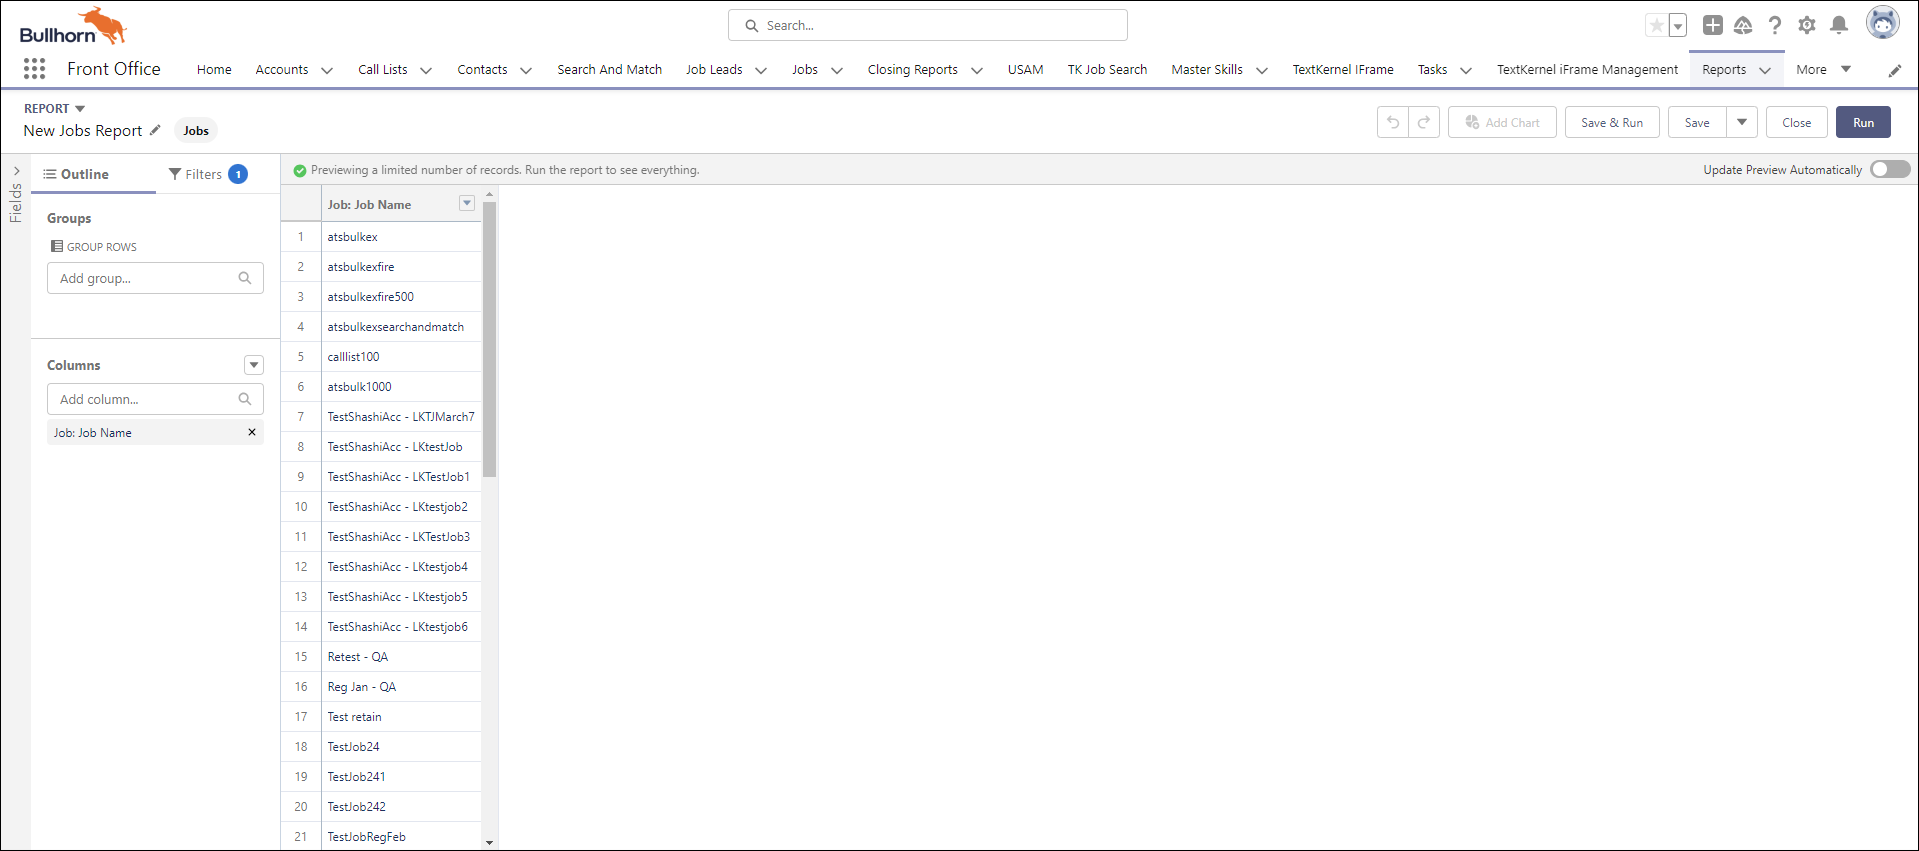
Add a Column to Your Report
- Choose a field from the Add Column picklist.
- Alternatively, expand the Fields pane.
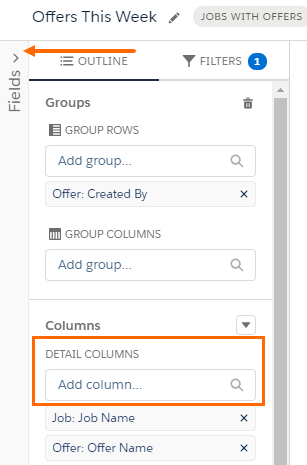
- Drag-and-drop a field onto the Columns list or directly onto the report preview.
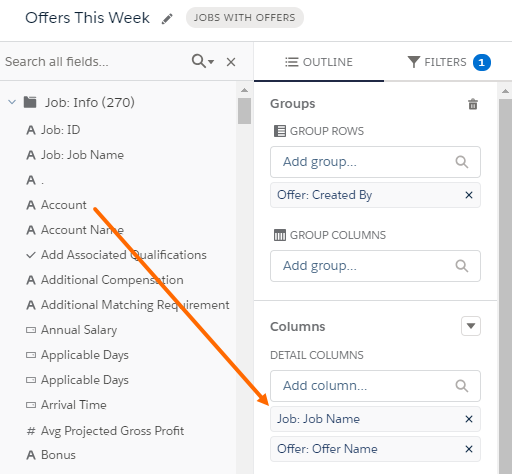
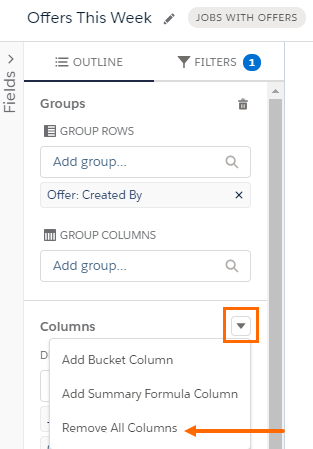
Remove a Column to Your Report
- From the Columns list, find the column you want to remove. Then click X.
- Alternatively, from the preview pane, find the column you want to remove.
- Go to Column Actions, and select Remove Column.
- To remove all columns from your report, from the Columns list, select Remove All Columns.
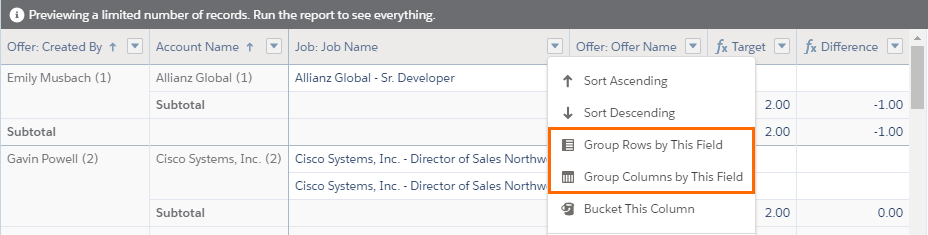
Group Records in Your Report
- Choose a column from the Add group picklist under GROUP ROWS.
- After grouping a row, you can group a column by choosing a column from the Add group under GROUP COLUMNS. Group up to 2 rows and 2 columns.
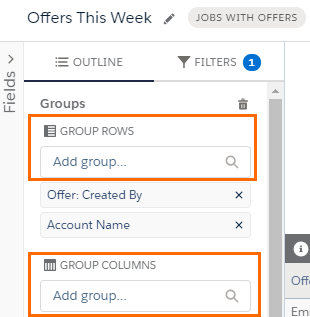
- Alternatively, from the preview pane, find the column you want to group. Click Column Actions dropdown, choose Group Rows by This Field (or Group Columns by this Field).
Ungroup Records in Your Report
- From the Groups list, find the group you’d like to ungroup and then click X.
- To ungroup all groups in your report, from the Groups list, click the Remove All Columns
 icon.
icon.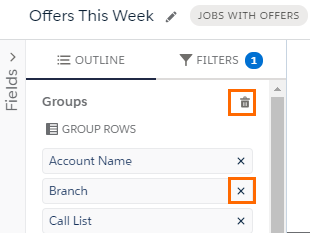
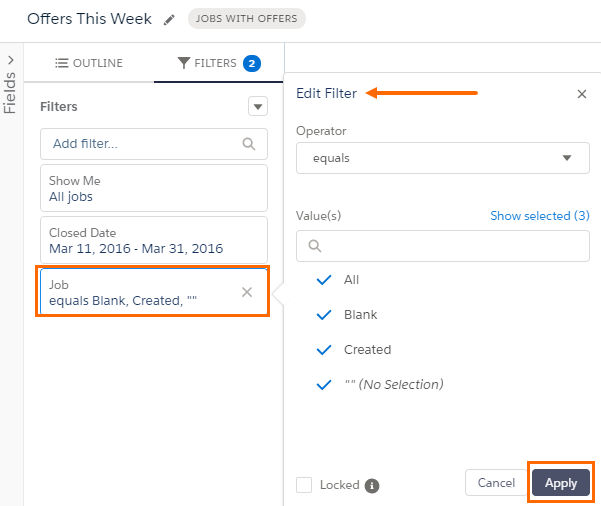
Filter Records from Your Report
- Select the Filters icon
 .
. - To add a field filter, choose a field from the Add filter picklist.
-
To remove a filter, click the X icon on the filter.
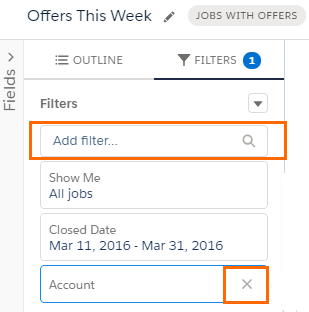

Depending on which report type you chose, your report has between two and four standard filters which are applied by default. Most templates include a Show Me filter and a Date filter. The Show Me filter scopes report results around common groups, like “my opportunities” or “all opportunities”. The Date filter scopes results around a date field, like “created date” or “closed date”.
- To edit a filter, including standard filters, select the filter, add edit and Apply.