| Edition: Enterprise | Audience: All Users |
Trends
Trends is a timeframe analysis tool which allows you to depict most metrics and ratios as line chart visualisations using dates as the X axis.
Multiple metric options and date aggregations enable you to build multiple charts to fit the particular story you want to tell, or trend you want to analyse. Trends does not require specialised knowledge to quickly and easily create custom charts and visualisations.
Whether you are looking to analyse per-head performance of teams and business units, compare client value over time or examine seasonality in key metrics, the Trends module allows users of any experience level to quickly identify actionable trends and share them with their colleagues.
Accessing Trends
You can access Trends in two ways:
- By clicking on the Trends module button at the top of the Bullhorn Analytics screen
- Via the Clickthrough on any Trendable metric in OneView or Dashboards.
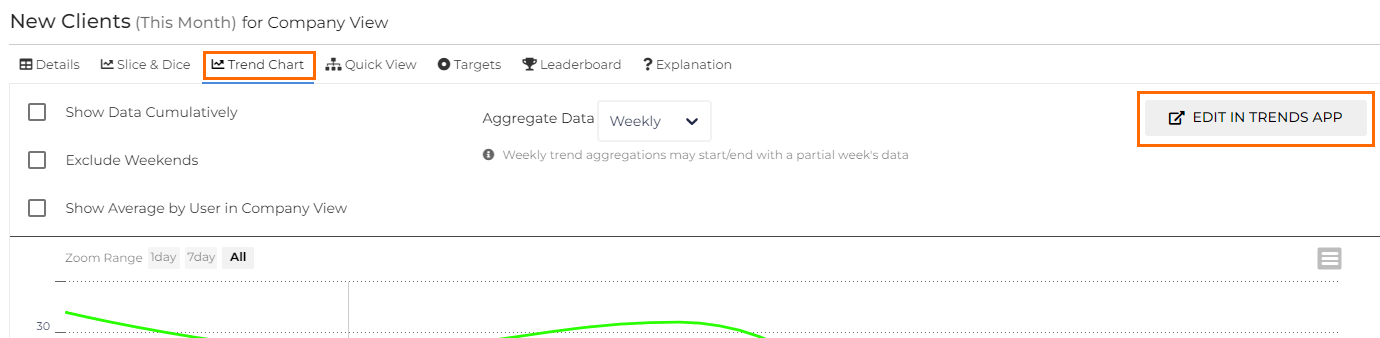
The version in the Clickthrough is a limited version of the Trends feature, where you can only view a Trend Chart for the selected metric and timeframe. If you want to do more, you can click on the Edit in Trends App button to access the main feature, carrying through the current Trend Chart to a more expansive array of options.