| Edition: Enterprise | Audience: All Users |
Edit Trend Chart
This article covers the different options for editing a Trend Chart.
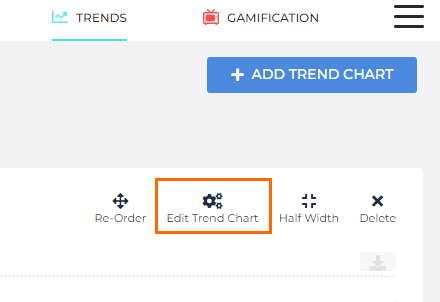
To edit a Trend Chart, click the Edit Trend Chart option in the top right corner.
Standard and Advanced Mode
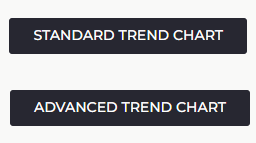
Trends can be edited in Standard or Advanced Mode. Advanced mode includes all options from Standard mode, plus some extras. Toggle these settings using the Standard Trend Chart / Advanced Trend Chart button in the top right of the editing window.
Editing Options

- Editing Chart: Choose a name for the Trend Chart on the page.
- Standard Trend Chart / Advanced Trend Chart: Use this button to toggle Standard/Advanced Mode.
- Plot Chart: Generate a chart visualisation using your chosen settings.
- Exclude Weekends: Toggle to remove Saturdays and Sundays from the timeframe axis.
- Weekend days with data will still be returned.
- Normal Dates: Plots every data point on the day of its KPI date.
- Period on Period (Advanced only): Plots every data point as days from the first date in the selector. This is used with multiple Data Groups (below).
- Data Groups (Advanced only): Allows you to overlay multiple Trends on the same chart. This is useful when comparing different Groups, but especially so when overlaying multiple timeframes in conjunction with the "Period on Period" option (above).
- Click + Add a data group to add a new set of chart options.

- You can also clone an existing data group and its chart options by clicking the clone (
 ) icon.
- Click + Add a data group to add a new set of chart options.
Add Metrics or Ratios

- Add Metric: Add one or multiple metrics to plot on your chart. Metrics will appear as their own rows with new options explained later.
- Not all metrics are ‘Trendable’. If any are missing from this drop down, this is likely to be why.
- Add Ratio (Advanced only): Ratios are just as interesting as metrics when plotted over time. You can select any ratio on your platform and add your own ad-hoc ratios befitting your analysis.
Choose a User or Group / Choose a Timeframe
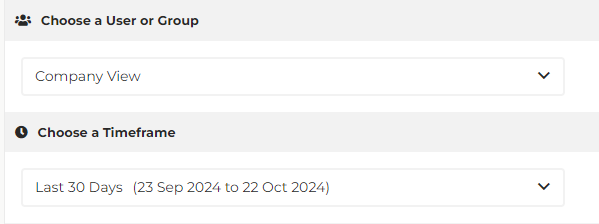
These allow you to select a user or group and a timeframe to filter your data down to.
Timeframes are particularly important on Trends as they track over time, with time as the X axis. You can compare multiple choices of group or timeframe using Data Groups.
Filter by Tags

Use these options to filter your data by Tags on users where filtering by hierarchy is not appropriate. You can filter over multiple Tag configurations on the same chart using Data Groups.
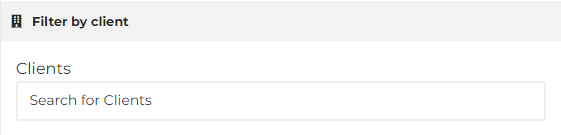
Filter by Client
Use this option to filter your trend by specific clients or groups of clients. You can use multiple Data Groups to compare different
clients / client groups.