| Edition: Growth, Corporate, Enterprise | Audience: All Users |
OnPoint Report Options
This article explains how to access OnPoint and what options are available to build, save, and share your report. For help on sorting and navigating your report see OnPoint Report Navigation.
OnPoint Options
To access OnPoint, click on the OnPoint module button at the top of the Bullhorn Analytics screen. At the top of the OnPoint page you'll see the following options:
Add Metric
Use this dropdown to select each metric you wish to insert into your OnPoint report to compare across your users or groups. OnPoint can be used to compare any metric (including Live metrics like Contractors Out or Live Jobs), but returns the most visually pleasing results when the metrics have targets.

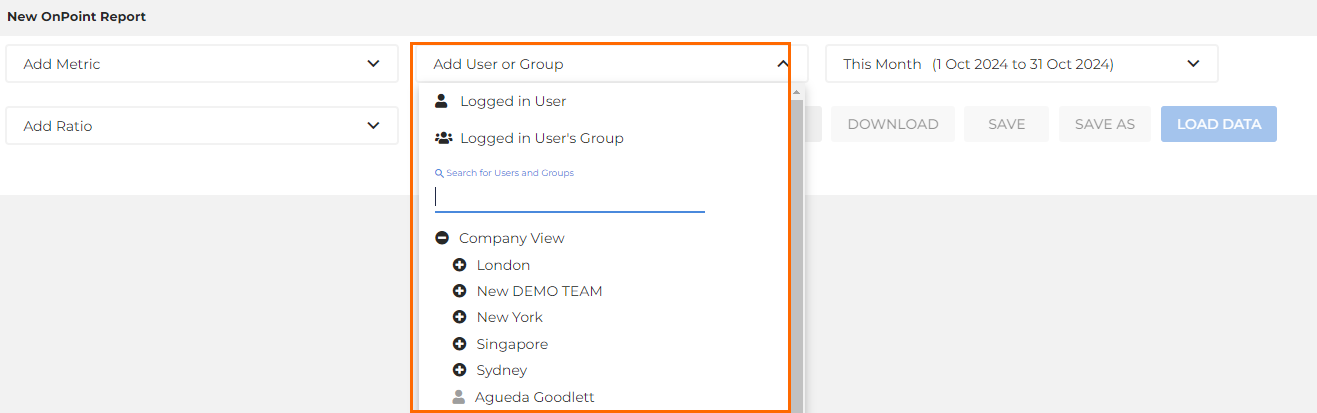
Add User or Group
Use this dropdown to select the relevant user(s) and group(s) to add to the report. If you select a group you are able to choose:
- The Group
- All Active Users in the Company View
- The Group and all sub-Groups and active Users in it
- The Group and all sub-Groups, deleted sub-Groups, and active Users in it
Timeframe Selector
Use this to specify the timeframe your metrics will be returning data for. Metrics that run for all time (Live Jobs, Contractors Out etc.) will not be affected by this.
Add Ratio
Use this dropdown to add any pre-existing ratio on your system, or create your own custom ratio specific to this OnPoint report.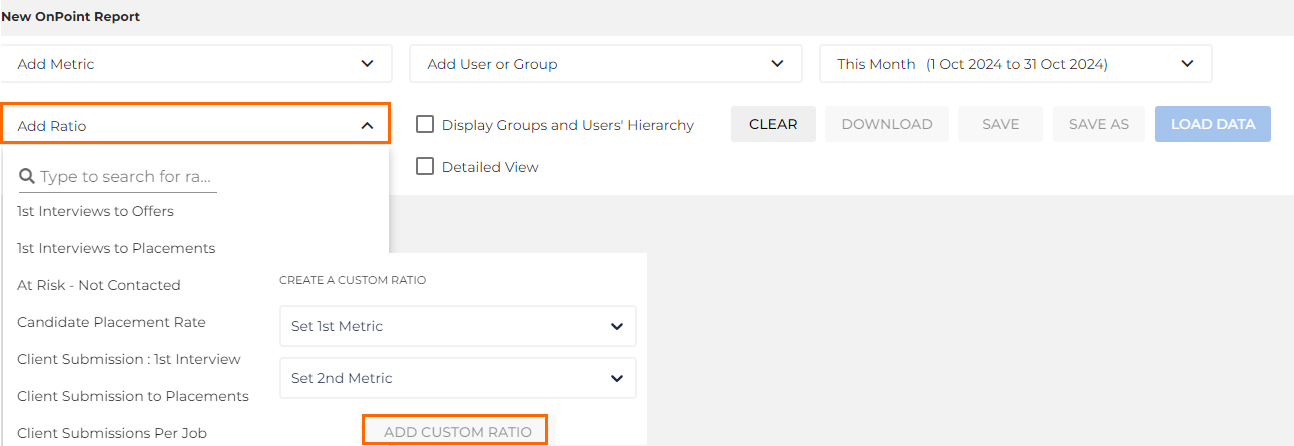
Display Groups and Users' Hierarchy Check Box
Checking this box will display the Group Hierarchy next to the relevant User or Group name. This allows you to see where they sit in the Group hierarchy, which will be the Group into which their data flows.

Detailed View Check Box
Checking this box changes the column content to include how far ahead or behind the individual is to the expected target line.
The expected target line is where that user or group should be for that target in that time period to meet the target.

Load Data Button
You need to click the Load Data button to return the relevant results of your OnPoint report. Reload any time you make changes to the metric or ownership dropdown selectors.

Saving OnPoint Reports
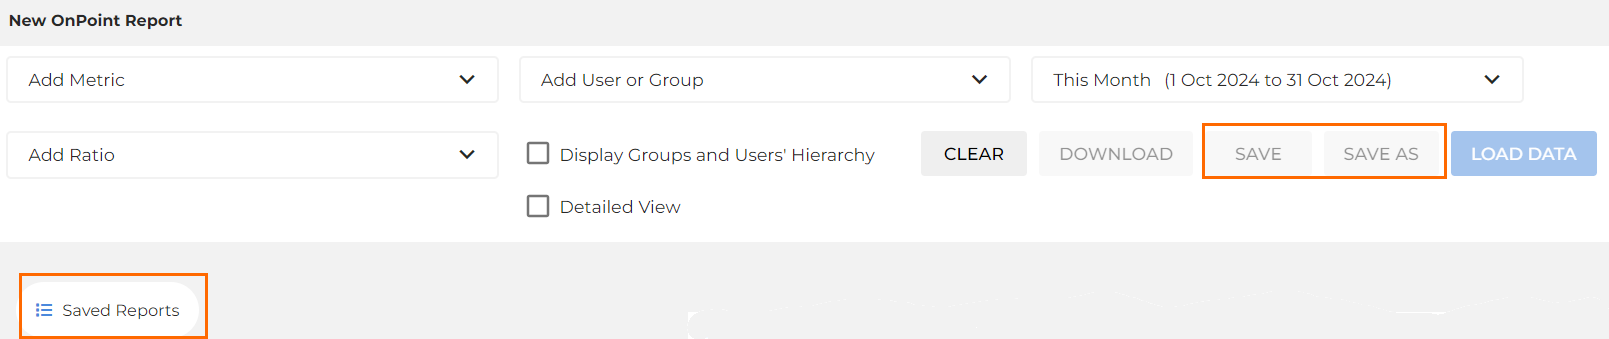
- Use the Save As button to name and save a new OnPoint report.
- Use the Save button to save a report you have modified.
- Use the Saved Reports button in bottom left to access previously saved reports and any reports that have been shared with you.
Sharing OnPoint Reports
- Select the Saved Reports button.
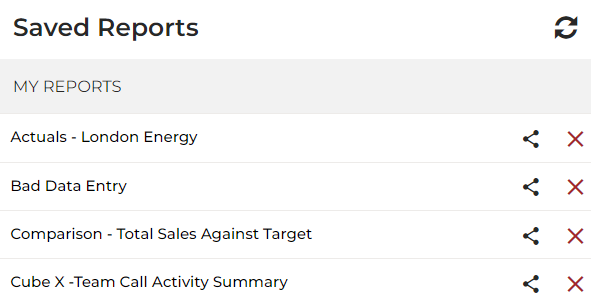
- Select the Share icon (
 ) against the report you want to share.
 - Click on any number of Groups or Users to add them to the Shared with column.
- Click Save to complete the report share.
To unshare you can click the X icon to unshare individual Groups or Users or use the Unshare with Allfunction to remove all sharing from the report.
Download Button
Use this button to download the current results into MS Excel. This will show the numbers being used to generate our display as separate columns (Metric Value, Metric Target, Target Achieved, and Target Expected) for each metric and user selected.
