Sample Report - Sales Activity
Bullhorn Reporting comes packaged with sample reports in order to give you a general feel for how the reports function and how they are created.
These reports are named similarly to existing Bullhorn reports, however the sample reports do not contain the same level of detail. Sample reports should be seen as an example of what is possible with Bullhorn Reporting. You have the ability to add as much detail to these reports as you like.
Sales Activity
Bullhorn Support is able to assist you with navigating the sample reports. However, Bullhorn Support is unable to build customizations on the reports for you. You'll need a Business Intelligence specialist who is familiar with writing database queries.
The Sales Activity Report tracks the sales activity for your users during a predefined time period. The credit for the activity is attributed to the primary department of the user who owns the Client Contact or Job.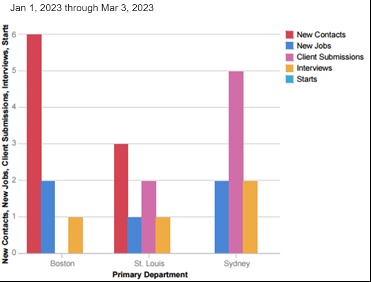
When you run the Sales Activity Report, you are prompted to select a date range. The report then displays information on the following data within your system, grouped by department:
| Data item in report |
Definition |
|---|---|
| Client Visits* |
Number of Notes added by all users in the department with a note action of Client Visit. |
| New Contacts |
Number of Contacts added by all users in the department. |
| New Jobs |
Number of Jobs added by all users in the department. |
| New Positions* |
Number of Openings (denoted by the Bullhorn field # of Openings) for Jobs added by all users in the department. |
| Client Submissions |
Number of Client Submissions (sendouts) added by all users in the department. |
| Interviews |
Number of Interviews scheduled by all users in the department. |
| Job Offers* |
Number of Internal Submissions added by all users in the department that are in status of Offer Extended. The Job Offers column also takes into account placements that were previously in a status of Offer Extended. |
| Hires* |
Number of Placements added by all users in the department. |
| Starts |
Number of Placements added by all users in the department. The Job and Placement will need to have been created within your defined reporting period. The Placement must have been in a status of Approved to count for the total number of starts. |
| New Jobs / Client Visits* |
Divides the number of New Jobs by the number of Client Visits for all users in the department. |
| Interviews / Client Submissions* |
Divides the number of Interviews by the number of Client Submissions for all users in the department. |
| Job Offers / Interviews* |
Divides the number of Job Offers by the number of Interviews for all users in the department. |
| Starts / Job Offers* |
Divides the number of starts by the number of job offers for all users in the department. |
| Hit Rate* |
Divides the number of Starts by the number of Client Submissions for all users in the department. |
| Fill Rate* |
Divides the number of Starts by the number of New Positions for all users in the department. |
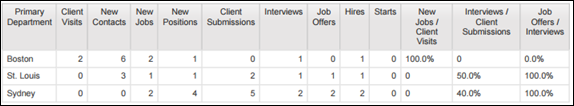
*This information will display in the table below the chart instead of the chart itself.
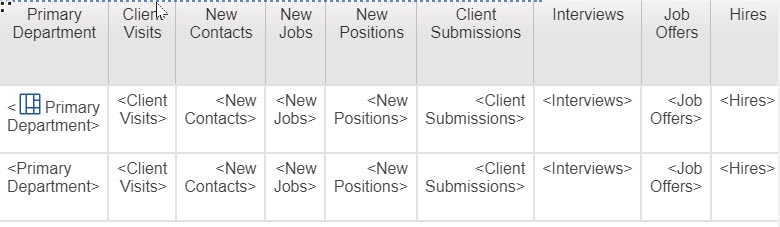
The report creates a chart as a visual representation of how each department is performing. A table is underneath the chart that gives you more insight on the exact numbers.
Modifying the Sales Activity Report
Bullhorn recommends making a copy of the sample report before editing so you can retain the original report. If you accidentally delete or overwrite the report, Bullhorn can restore the stock sample report for you.
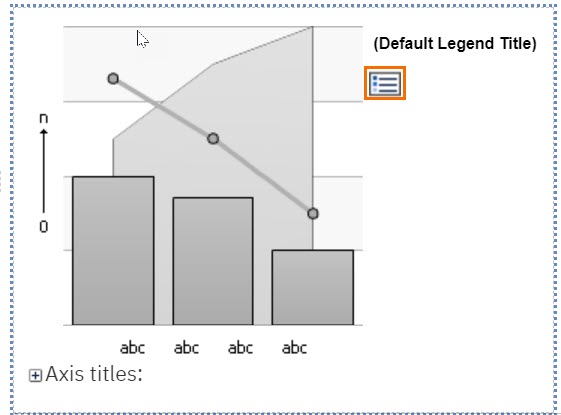
When modifying this report you will see a chart and a table in the Canvas Studio. The chart allows you to see how data items are placed to give you a better visual on how to build your own charts.
Important information for modifying this report:
- The chart is pulled from the Toolbox section.
- The data within this report is drawn from the Note Analysis source. Anything added to this report will need to come from that source.
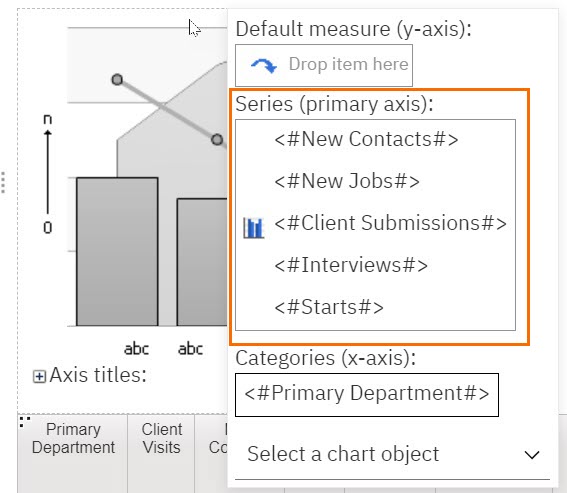
- Click the icon under (Default Legend Title) to modify the charts. Double-click data items within the Series (primary axis) to view the expressions that calculate the outcome for this report.
- The table underneath the chart is comprised of the data from the chart and includes a few additional columns. Double click on the contents of each column if you would like more information on the expression definitions and the queries.
- If you choose to remove a column that is used in a query, you will receive an error when you run the report. To resolve this also remove the column with the query that references the column you removed.
- For example, if you remove the New Jobs column, you will receive an error as that column is used to calculate the New Jobs / Client Visits column. To prevent the error from occurring remove the Client Visits column.