| Edition: Growth, Corporate, Enterprise | Audience: All Users |
Ratios
Ratios are displayed on tiles at the bottom of the OneView page. They look at the value of one metric divided by another to help measure the effectiveness or efficiency of your team's performance. You can view ratios over a larger timeframe to get valuable insights into performance over time.
For a ratio of CV Sent to 1st Interview, you'd typically want to ensure that you get as many interviews as possible from the CVs you send to client contacts, so a low CV send-to-interview ratio (as close to 1:1 as possible) is a benchmark to work towards.
Ratios in OneView will contain the data specific to the user or group being viewed. Ratios can be displayed in several formats, as set by a OneView Page Admin:
- Percentage: Expressed as a fraction of 100 e.g. 10 1st Interviews to 2 Placements becomes 20%. This value is rounded to the nearest whole number.
- Normalised: This converts the lower value metric to 1 and adjusts the other accordingly e.g. 10 1st Interviews to 2 Placements becomes 5:1.
- Fraction: The ratio will be displayed as a fraction with the lowest common denominator, e.g. 80 1st Interviews to 24 Placements becomes 10/3. 80 1st Interviews to 23 Placements = 80/23.
- Decimal: This divides the value of the 2nd metric against the first and displays it as a decimal amount e.g. 10 1st Interviews to 2 Placements becomes 0.2. This value is rounded to a maximum of 2 decimal places.
- Absolute: This will show the actual value of each metric e.g. 10 1st Interviews to 2 Placements becomes 10:2.
Ratio Details and Trend Chart
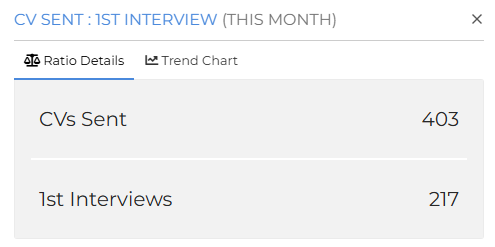
Click on any ratio in OneView to view the ratio details. This will show the current value of each metric in the ratio.
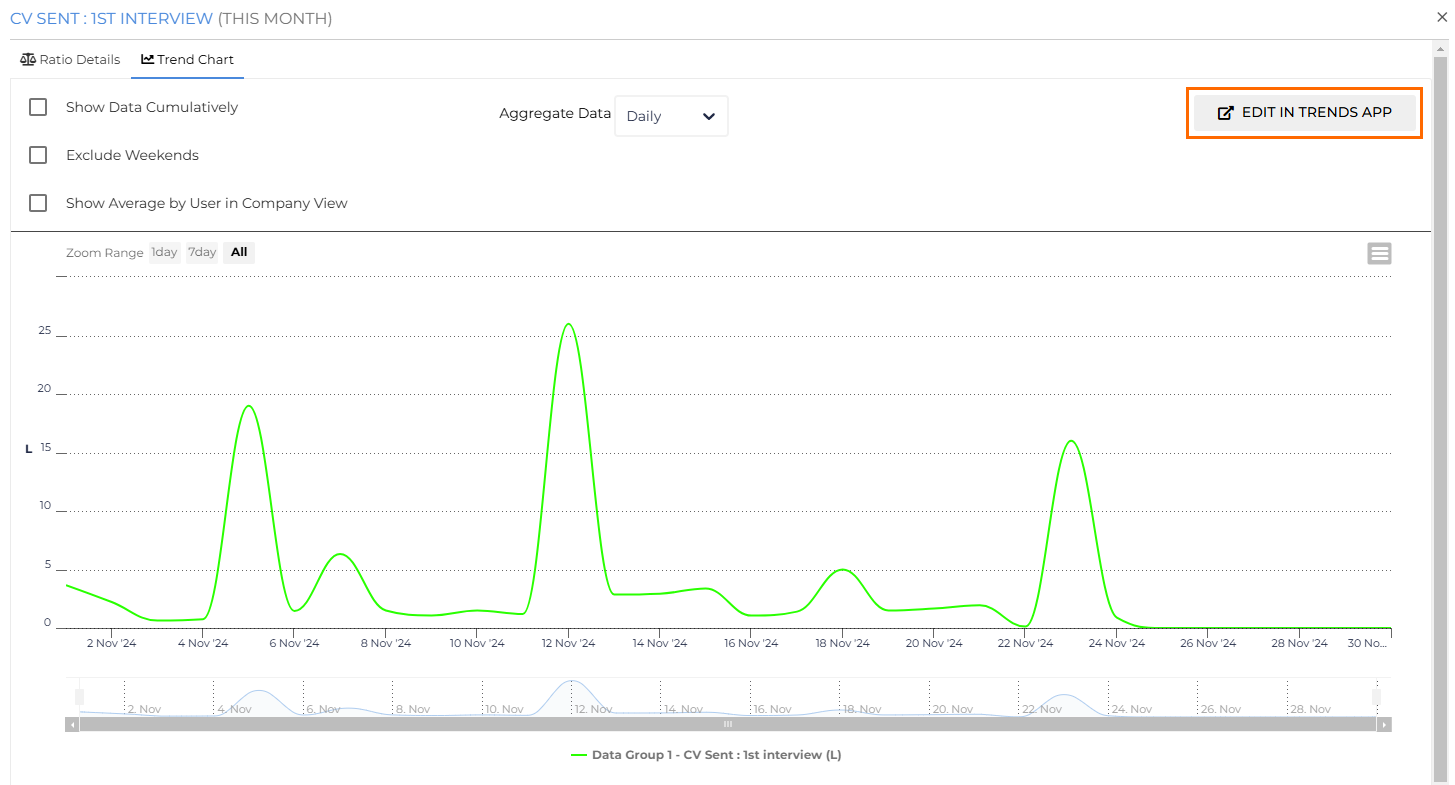
If you have access to the Trends, you can select Trend Chart to visualise ratio performance over the selected timeframe. You can click Edit in Trends App to open the current report in the main Trends module.