| Edition: Growth, Corporate, Enterprise | Audience: All Users |
Jobs Pipeline Navigation
This article shows you how to navigate the Jobs Pipeline. For a guide to the available filtering and searching options, see Jobs Pipeline Options Navigation.
Job / Candidate Charts
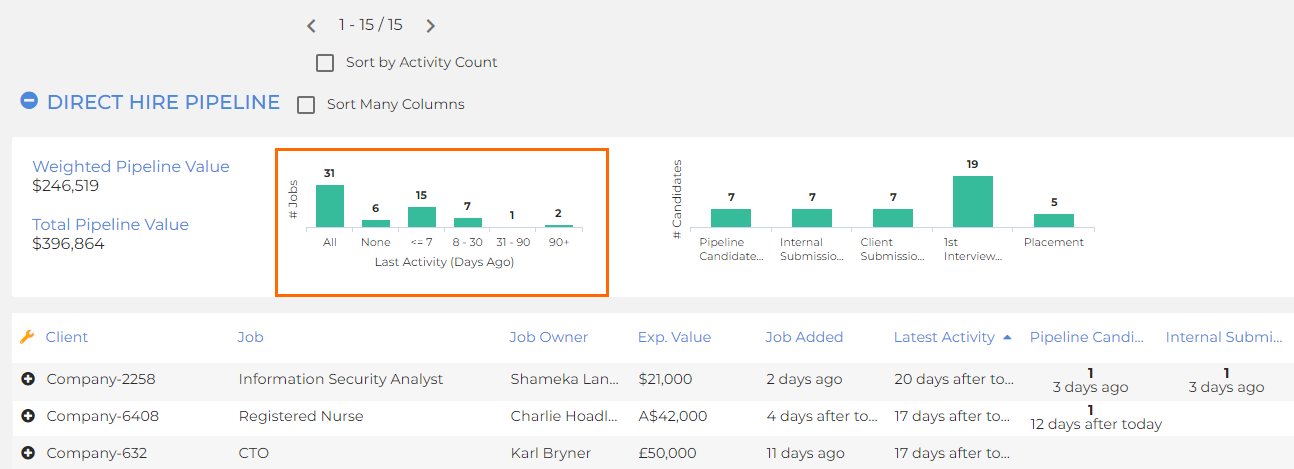
The Jobs chart will show you how many Jobs/Vacancies there are in total in the pipeline, how many have no activity and how many have activity within each of the preset time brackets.
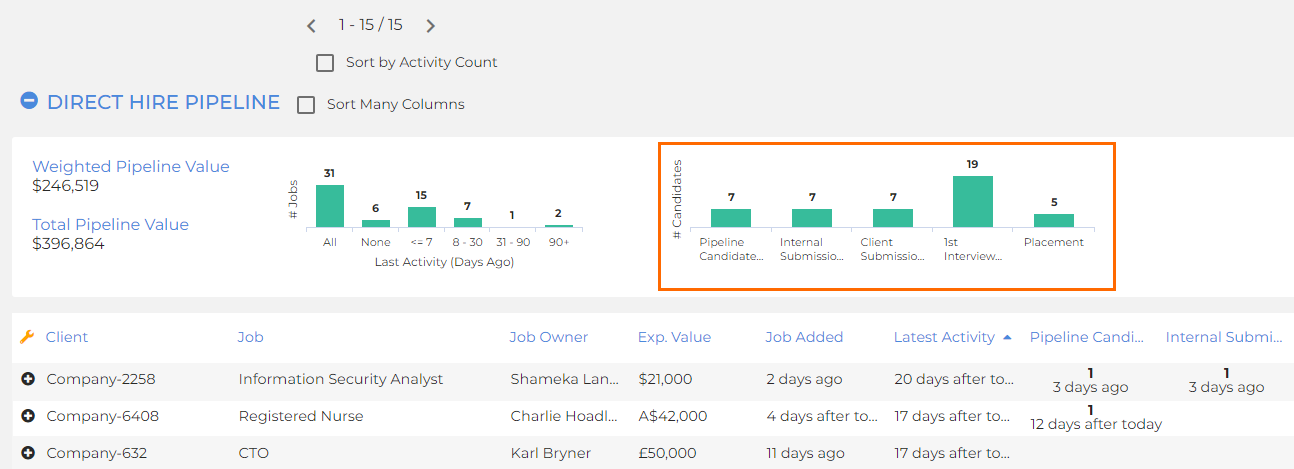
The Candidates chart is dynamic, and will show you how many Candidates there are in each milestone based on the timeframe selected for latest activity.
Column Sorting
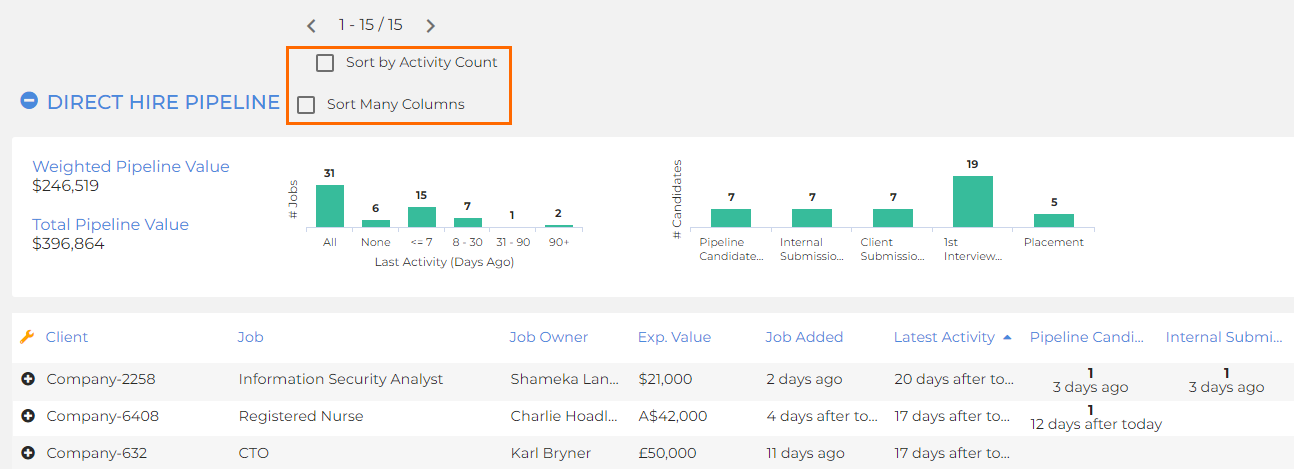
Clicking on any stage column header will sort the results by latest activity date. You can click on Sort by Activity Count to sort by activity volume instead. You can also click Sort Many Columns to enable sorting by multiple column values.
Personal Pipeline Options
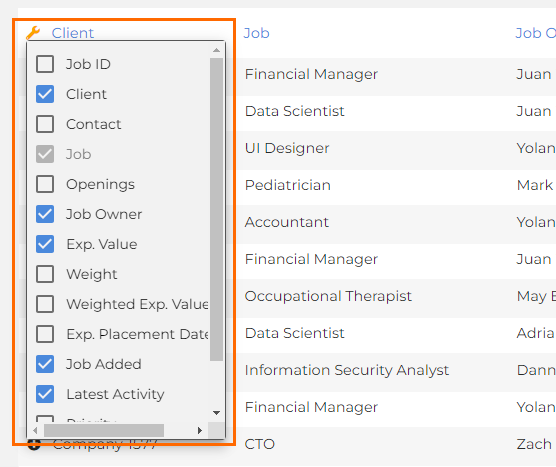
Click the golden wrench / spanner ( ) to open an array of options which allow you to personalise your Jobs Pipeline display. Add or remove columns by ticking or unticking accordingly.
Data Details
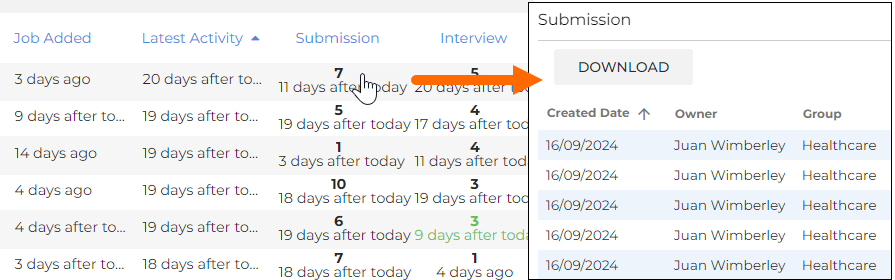
Click on any values in the pipeline milestones to access the data details.
Job and Candidate Details
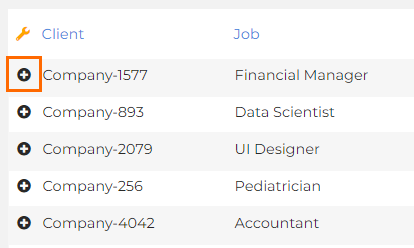
Clicking the + icon next to a job will expand it to show key details about the job including Last Activity, First CV/Resume Sent time, Expected Value and Expected Placement Date (if entered). You’ll also see every candidate in the pipeline for that Job.
A candidate will appear if at least one of the milestones in the pipeline has been actioned. After Job/Vacancy Added, the first milestone will be Shortlisted/Internal Submission or a client-facing action such as CV Sent/Client Submission.
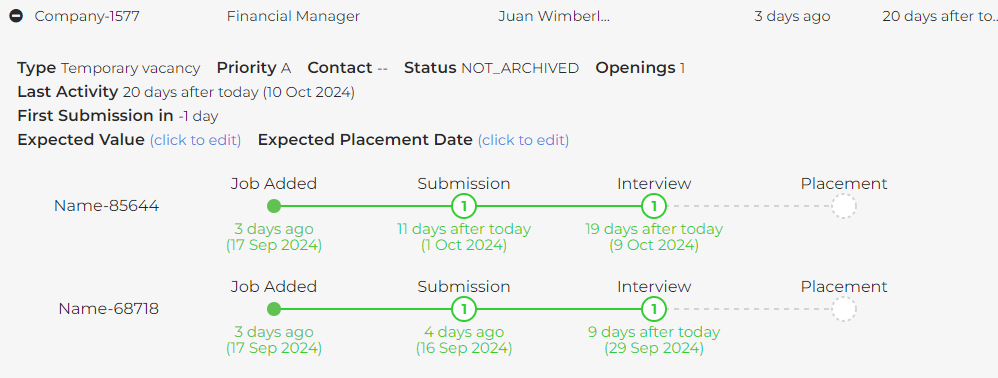
Green lines, timestamps and nodes indicate that a milestone has been actioned; grey lines and crosses indicate that a milestone has not been actioned. For example, if there is a milestone in the process missing (in this case, the Submission), it will look like this:
