| Edition: Enterprise | Audience: All Users |
Adding Rows and Columns to a Slice & Dice Report
This article explains how to add variables as rows and columns in a Slice & Dice report. Adding variables to a report allows you to report over any aspect of your data with greater flexibility and depth. For a guide to generating a report, see Creating a Basic Slice & Dice Report
Variable Options
Above your report you can see a number of blue variable options. These are generated by the metrics used in the report and are made up of the columns that sit in the data details for that metric.
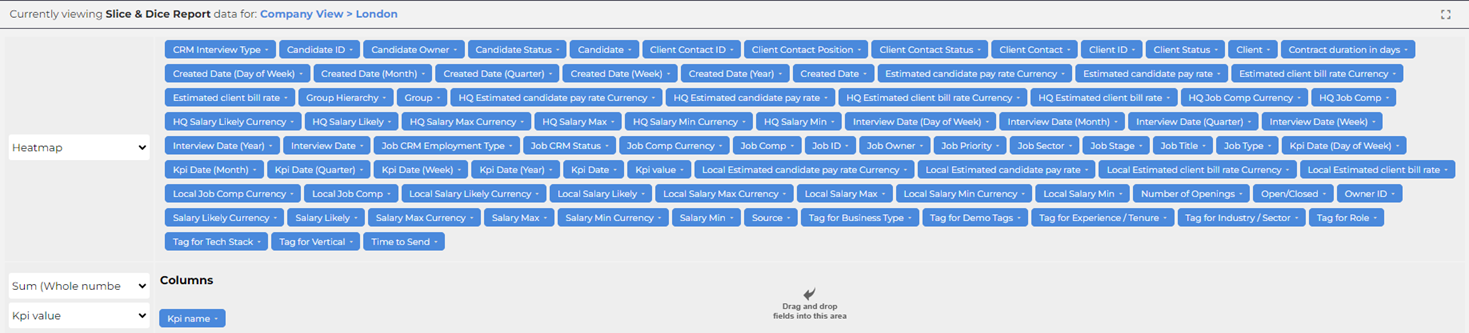
If you are not seeing one of the blue variable options you'd expect to see for a specified metric, please contact your administrator. If you are the administrator, then you can contact Support for assistance.
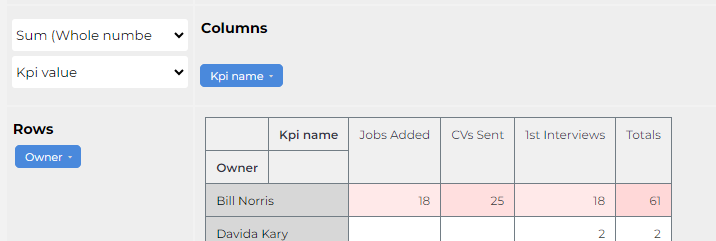
Every newly created report will automatically be broken out by Owner. This is the user who generated the activity within the ATS / CRM. You can see this listed under Rows to the left of the report.
Kpi name (the name of the metrics selected for the report) will default into the Columns which will show each metric selected in the report in a separate column.
Adding Rows and Columns
Drag and drop a variable into either the Rows or Columns area to add it to the report.
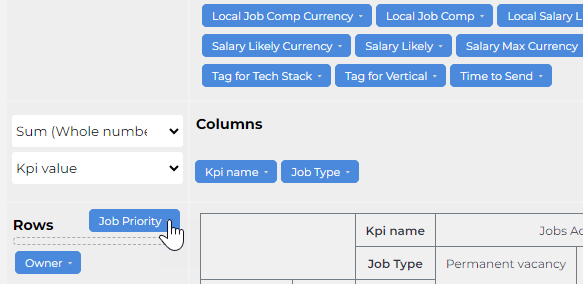
There is no limit on the number of variables that can be used in a report. Each variable can be added as a row or a column, allowing you to generate the report in any format you need.
Each variable can be filtered to drill down on specific data. See Filtering a Slice & Dice Report for more information.