| Edition: Enterprise | Audience: All Users |
Creating a Basic Slice & Dice Report
This article walks you through the steps to create a basic Slice & Dice report.
Steps to Build a Report
1. Select Metrics
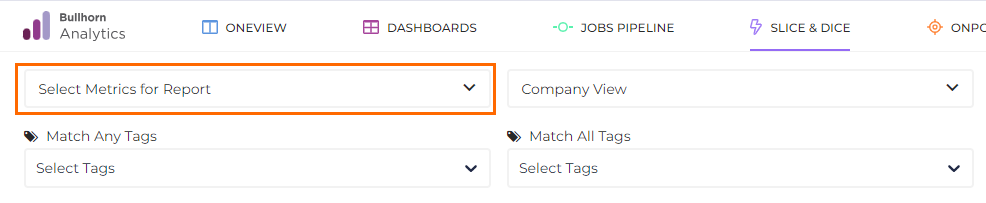
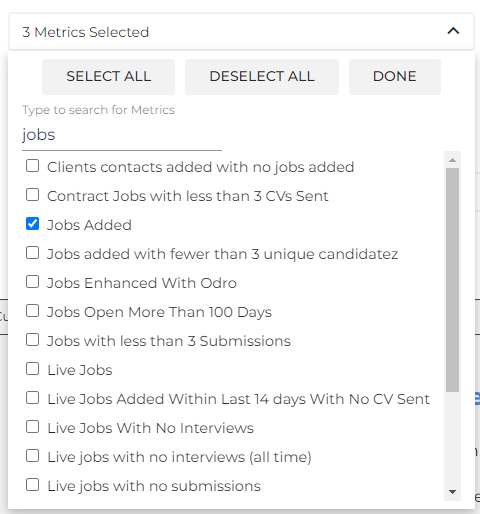
To create a Slice & Dice report, begin by choosing your desired metrics from the Select Metrics for Report dropdown menu. A free text search field is available to help refine your results.
For this demonstration, we'll use 1st Interviews, CVs Sent, and Jobs Added.
2. Select Group / User
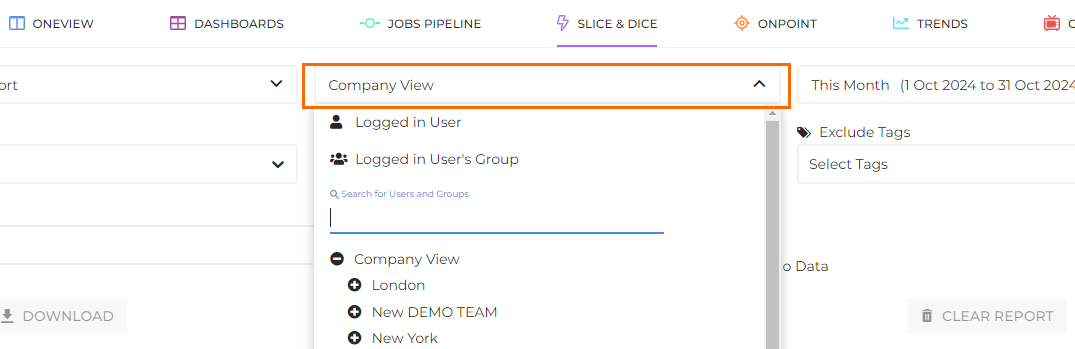
Once you've selected the metrics, use the Company View drop down to drill down to the group or user which you'd like to report on.
3. Select Timeframe
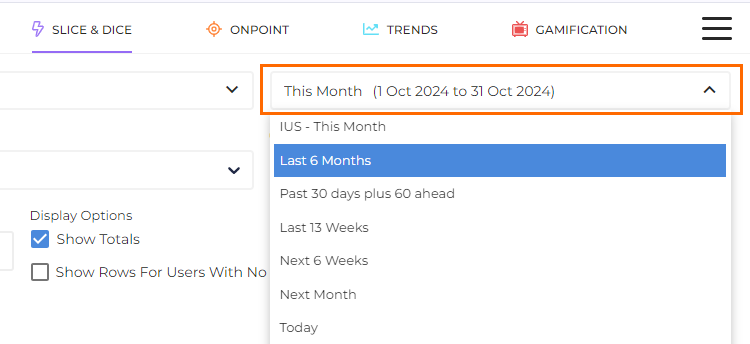
Choose a timeframe for which you'd like to run the report. You can also create a custom timeframe.
4: Select Tags and Clients
You can further refine your report with Tags. You can use any combination of the following three options:
- Match Any: This works like an OR operator. If any results from the metrics selected match any of the selected Tags, then they will be displayed in your report.
- Match All: This works like an AND operator. If any results from the metrics selected match all of the selected Tags, then they will be displayed in your report.
- Exclude: This will exclude results that match any of the selected Tags.
You can also refine your report by searching for specific clients to filter by.

5. Generate, Download, or Save Report
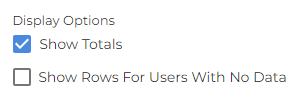
The Show Totals option is enabled by default. Unchecking this option will remove the blue Totals column and row.
Once you have configured the report to your needs, click the Generate Report button to display your results. If you need to start from scratch, click Clear Report.

The Download button allows you to download the report output in an Excel file for in depth data investigations or to share with your
team. Only users with the appropriate permissions can download reports.
Save Report allows you to save reports to be run again later or shared with other members of your team. Saved reports can be
accessed via the Saved Reports button at the bottom of the page. See Saving a Slice & Dice Report for more information.

Once you've generated a Slice & Dice report, you can hide the config section by clicking on the Full Screen ( ) icon under the Generate Report button.
Be aware that if you choose to run a report over a very large number of metrics, across the whole company, or for very large timeframes, that browser performance may affect report generation.
Adding Variables and Filters to a Report
To expand your report with additional variables and filters, see the following articles:
Example Report Output
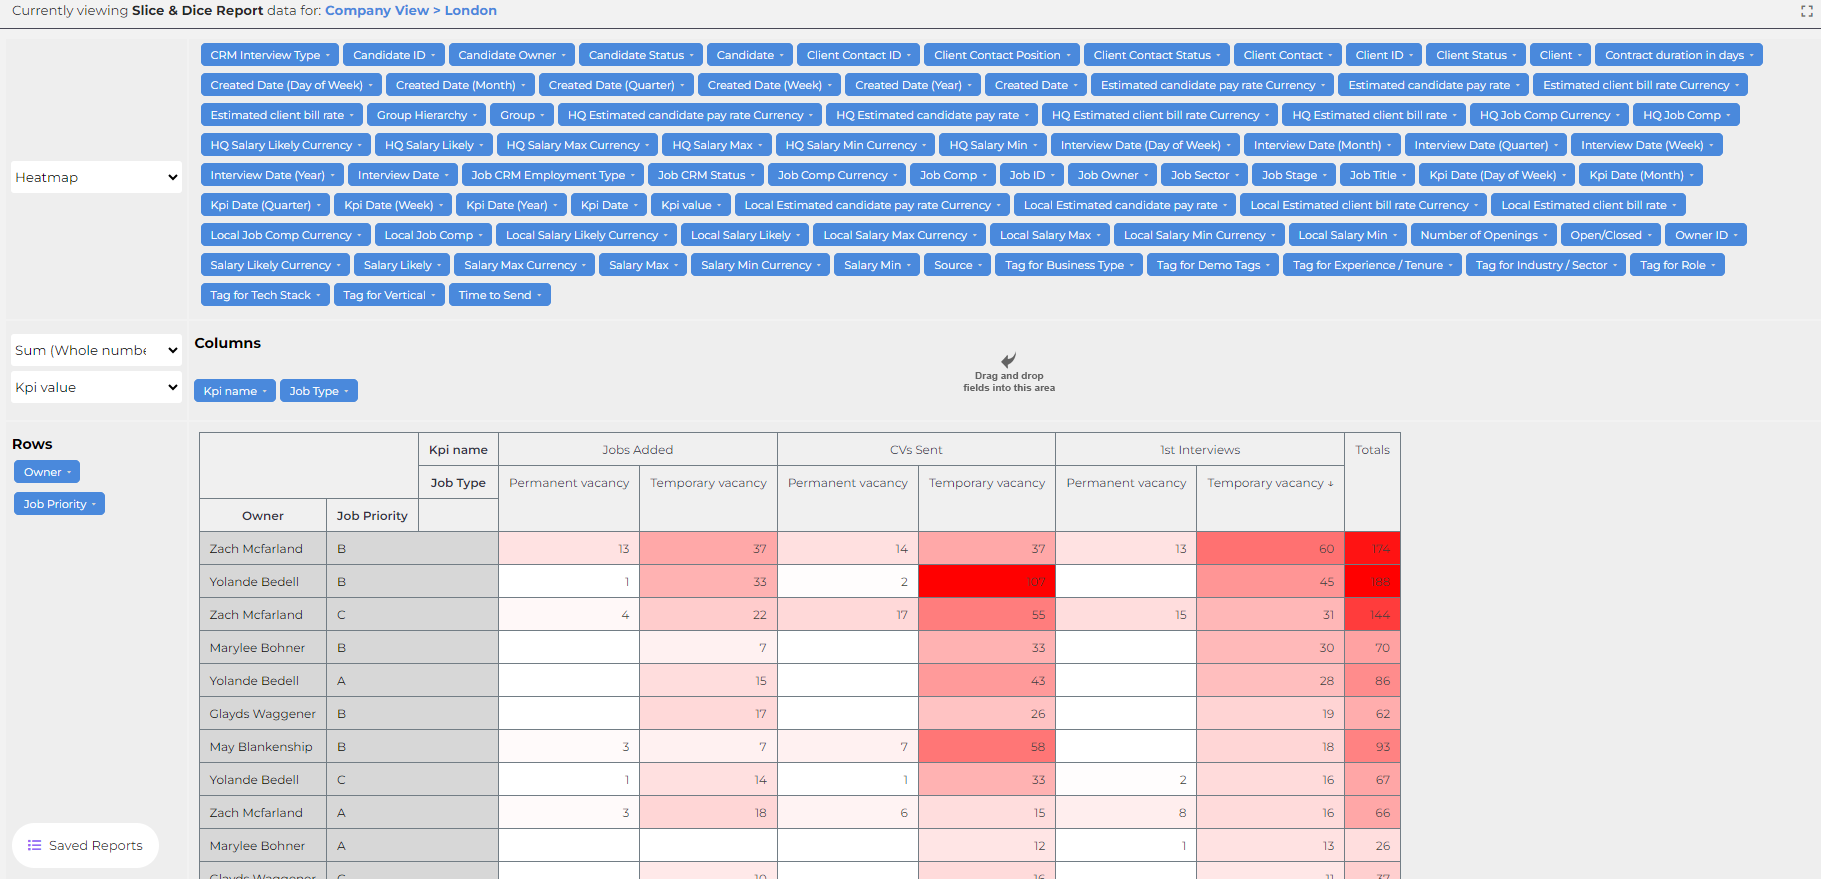
The image below shows a sample Slice & Dice report with the Jobs Added, CVs Sent and 1st Interviews metrics selected. The report is filtering by Activity Owner.
Two additional variables have been pulled from the list above: Job Priority was added to the rows and Job Type was added to the columns.
The report is in a Heatmap format showing a darker shade of red for higher values. Clicking on any "KPI Name" column will apply an ascending/descending filter.