| Edition: Enterprise | Audience: All Users |
Slice & Dice Navigation
This article explains how to access Slice & Dice and navigate the different filtering and display options. For information about the report building options, see Slice & Dice Report Building Options
Accessing Slice & Dice
You access Slice & Dice in two different ways:
- Click on the Slice & Dice module button at the top of the Bullhorn Analytics screen
- Access via the clickthrough on any metric in OneView or Dashboards.
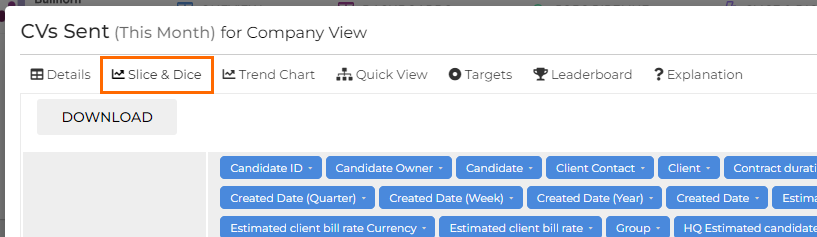
The version in the clickthrough is a limited version of the Slice & Dice feature, where you can only view a report for the selected metric and timeframe. If you want to do more, you can click on the Edit in Slice & Dice App button to access the main feature, carrying through the current report to a more expansive array of options.
If you are reporting over a selection of clients via Filter by Client or using a saved Client Set, you can click on a metric to go through to the clickthrough Slice & Dice feature. This will pull through the Client Set into your report. If you open the main Slice & Dice feature using the Edit in Slice & Dice App option, your Client Set will be pulled through.
Display and Filtering Options
Each Slice & Dice report requires at least one metric to be selected for the report, however, you may choose to use as many as you’d like. Updating additional report fields such as Company Hierarchy or Timeframe will allow you to further refine your report.
Tags allow you to add additional structure to your data outside of the company group hierarchy.
Finally you can narrow the results of your report to specific clients or groups of clients.
Report Metric

Select one or more existing Analytics metrics to start your report. This is the only field you're required to populate in order to build a report.
Hierarchy Selection

By default this will display the top-level group to which you have access. If you have permission to see all company data, this dropdown will contain the account's full group and user structure.
Timeframe Selector

Default options are available, and you also have the ability to enter custom date ranges.
Tags Selection

- Match Any Tags: The search will return all results with any of the tags you select from this dropdown.
- Match All Tags: The search will return all results that have all of the tags you select from this dropdown.
- Exclude Tags: The search will exclude all metrics that have any of the tags you select from this dropdown.
Clients Search

Use this search bar to build a report targeting specific clients.
Display Options

- Show Totals: Check this option to add a row to the report results showing the column totals, and a column showing the row totals.
- Show Rows For Users With No Data: Check this option to include users with no data in the report.
Other Options


- Generate Report: Click this when you're ready to see the report.
- Clear Report: Click this to reset all values in the dropdowns to default.
- Save Report: Click this to save the current report. When you click this option you'll be prompted to enter a name for the saved report.
- For more information on saving reports and viewing saved reports, see Saving a Slice & Dice Report.
- Download Report: Click this to download a copy of the report results in a .csv file.