Filtering Analytics Dashboards
Overview
This article will detail the various options available to add Date Filters into an Analytics Dashboard. The examples provided below will be based around the Default Dashboard - Assignment Forecast. To apply the filters described below (with the exception of the Combo Filter) you will need to Clone the Default Dashboard first and then add the filters to the cloned Dashboard in edit mode. The terminology discussed in this article has been discussed in detail in the previous guides on how to Create and Edit Dashboards Pt1, Pt2 and Pt3.
This article covers:
- Using a Combo Filter
- Using a Range Widget
- Adding Filter Criteria to a single Dashboard widget
- Adding a Master Filter to a Dashboard
Using a Combo Filter
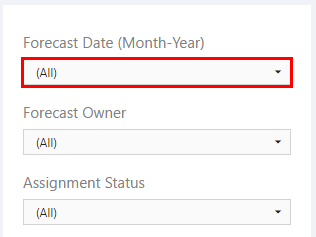
Combo filters can be used to easily filter by date. This dashboard contains a Combo Filter as part of a group which is already bound to the Forecast Date field:
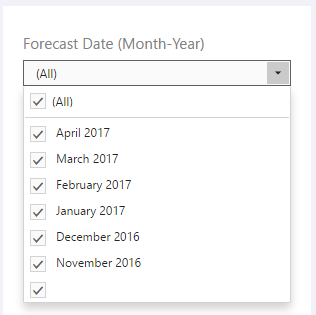
To Filter by Date, click into the Drop Down and make a selection:
As this Widget acts as a Master Filter for all other Dashboard Widgets it will then update all other widgets to only show Assignment information that falls within the date selection.
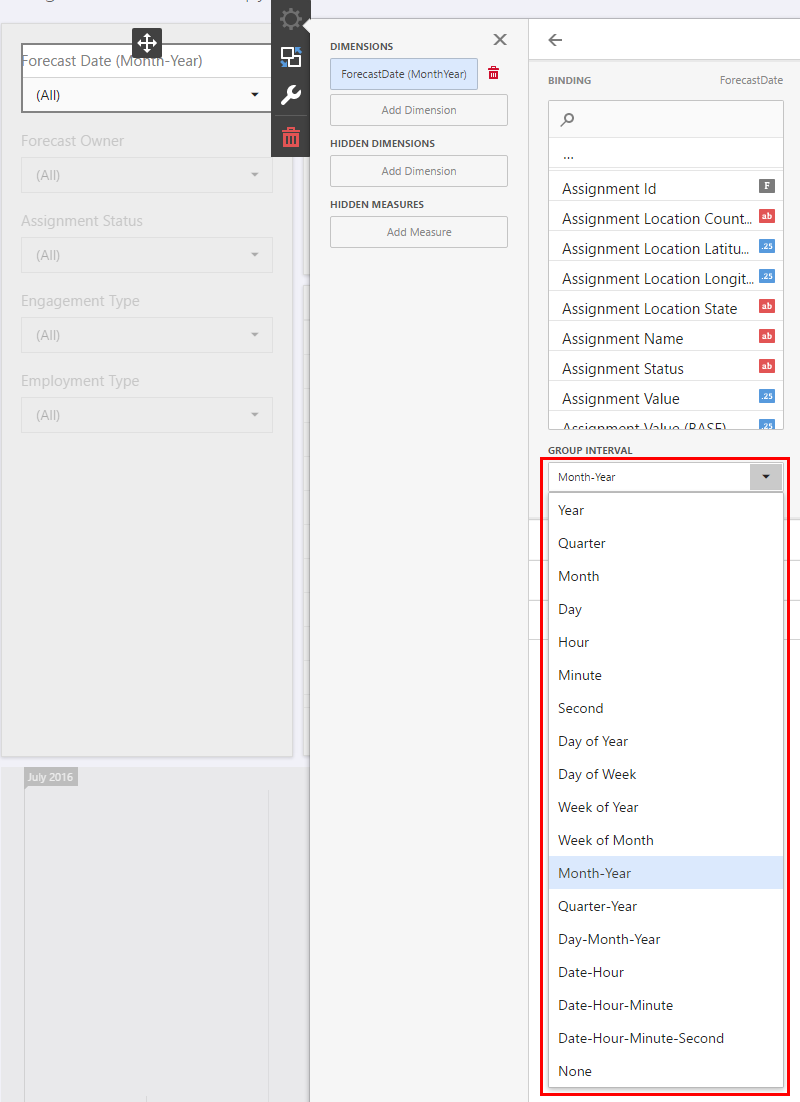
If you prefer this widget to group by a different interval, click into Edit mode then choose from the alternative values such as Week - Month etc:
Note that the Dashboard will not retain the filter settings in between user sessions and the next time the Dashboard will be accessed by any User it will return to the default values. The options described below for Adding Filter Criteria and Calculated Field will allow a user to set a permanent Date filter if they wish.
Using a Range Widget
A Range Widget provides a graphical representation of a date range and allows a user to change the filter to set the start and end date.
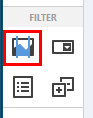
To add a Range Widget to a Dashboard, click Edit on the Dashboard you wish to add the widget to, then click the Add Range Widget Icon:
Drag it to the desired location on the dashboard using the move icon. Due to the design of this widget we would advise to allow for a significant amount of horizontal space.
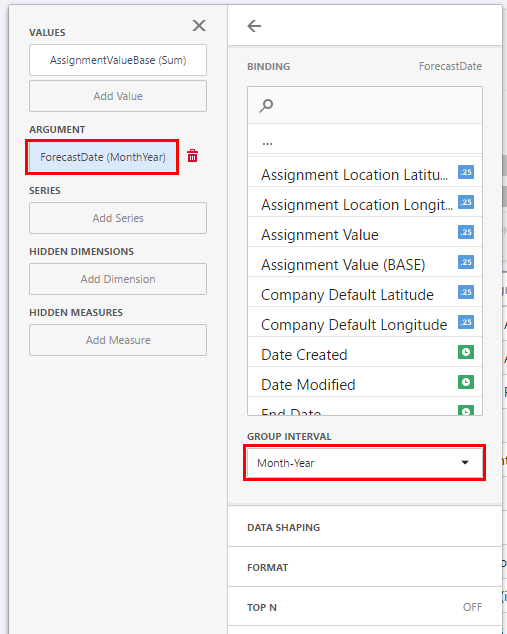
In this example we will bind the AssignmentValueBase as a value and the ForecastDate as the argument by clicking into the Binding icon:
In the screenshot below we have added the data bindings and set a Group Interval of Month-Year for the ForecastDate argument:
This widget act's as a Master Filter and will update all other widgets on the page.
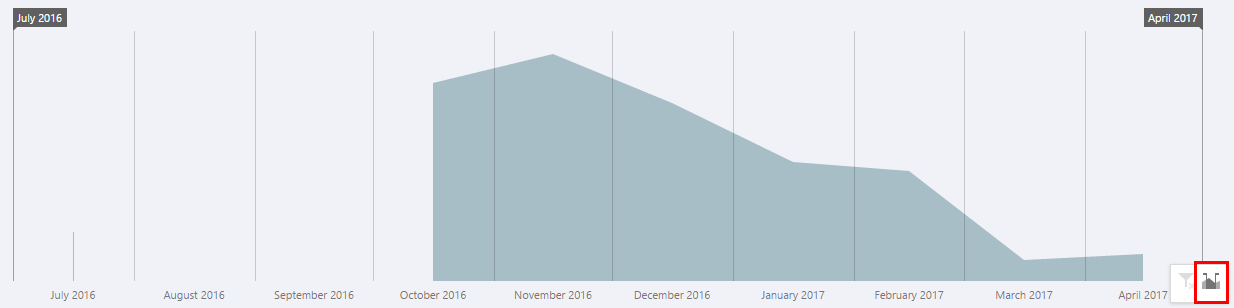
Click SAVE to retain your changes and return back to the viewer mode. You can now easily drag and drop the start and end dates on the filter by clicking into the filter icon, highlighted below:
This will open a Range filter window as shown below:
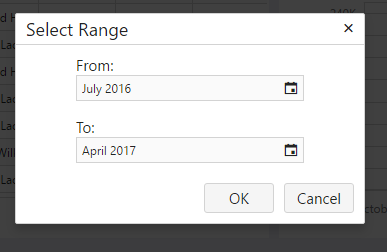
The Dashboard will update to reflect the selected range.
Note that the Dashboard will not retain the filter settings in between user sessions and the next time the Dashboard will be accessed by any User it will return to the default values. The options described below for Adding Filter Criteria and Calculated Field will allow a user to set a permanent Date filter if they wish.
Adding Filter Criteria to a single Dashboard Widget
It's also possible to add a filter into the Edit Menu which automatically filters date by a number of different parameters. This is useful if you wish a Dashboard to always have a date filter which cannot be removed by a user outside of going into Edit mode.
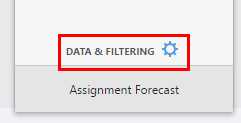
In this example we will add a date filter to a Combo Filter in our example Dashboard. If you click into Edit Mode, then into the combo widget which is bound to Forecast date, then Settings and Data & Filtering:
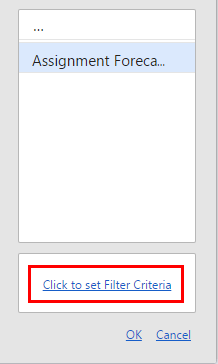
Then Click to Set Filter Criteria:
Which then opens the Filter Editor as shown below:
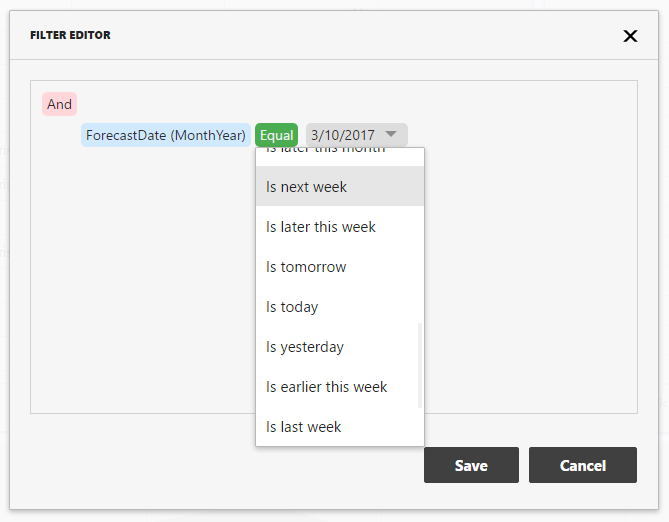
In this example I have added Forecast Date as a Condition and have set the Operator to Is Next Week. Note the other options available in the drop down.
Save the Filter, then Save the Dashboard to exit edit mode and this will add the filter to the selected Widget. As the Combo Filter is a master filter for the whole Dashboard it means the whole Dashboard will be effected by the selected Filter.
Adding a Master Filter to a Dashboard
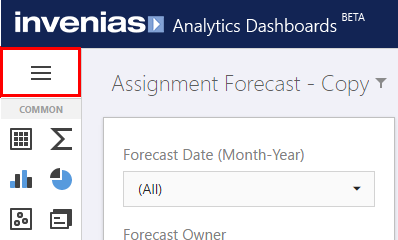
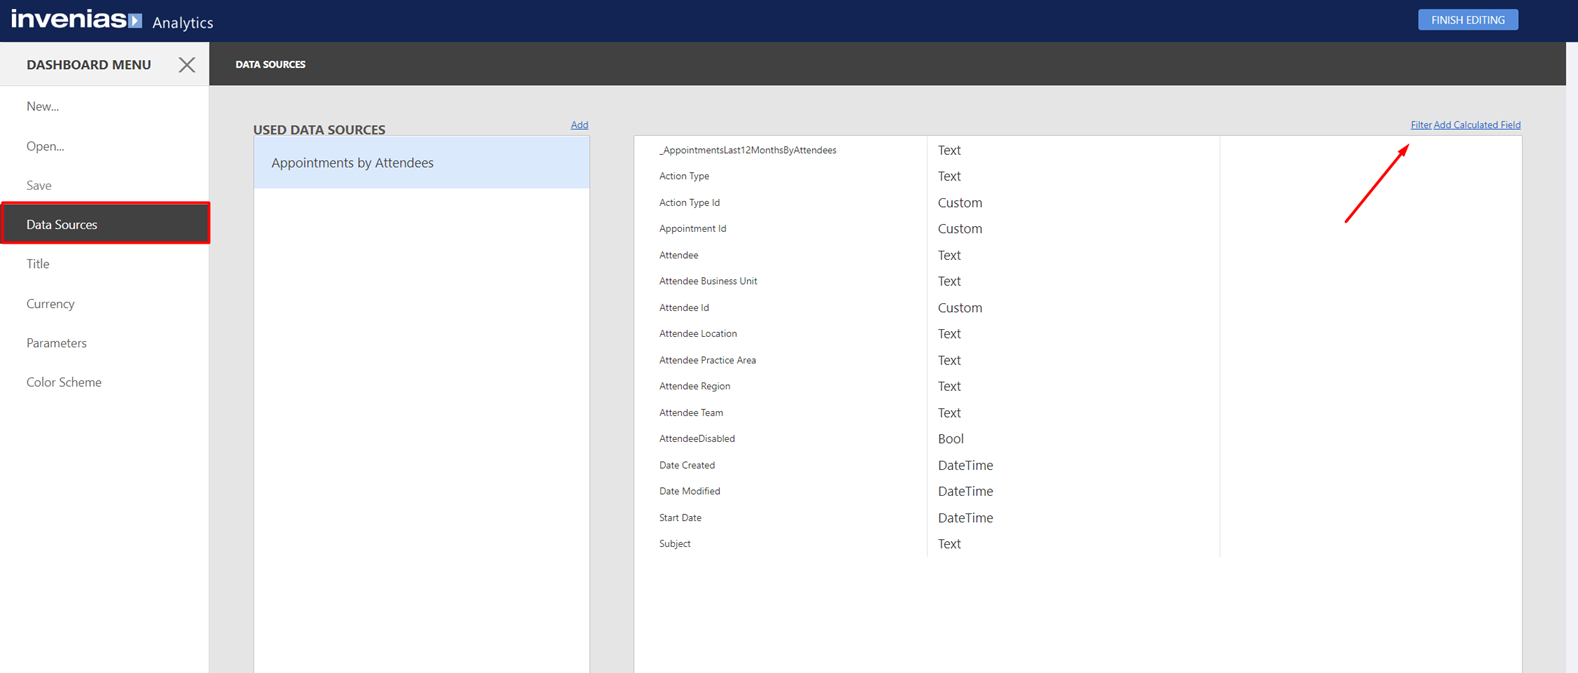
Master Filters can be applied to limit the data that is loading in all of the widgets in your Dashboard. To do this, first open the dashboard in edit mode, then click into the Hamburger menu in the top left of the screen:
Then Click DATA SOURCES and the "Filter" link in the top right:
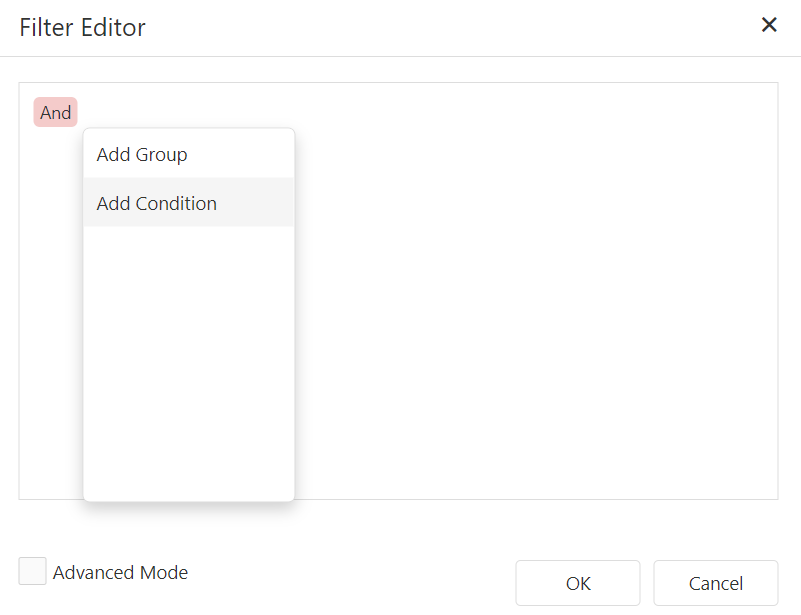
In the new window that opens, Click the "+" icon next the And operator and click Add Condition
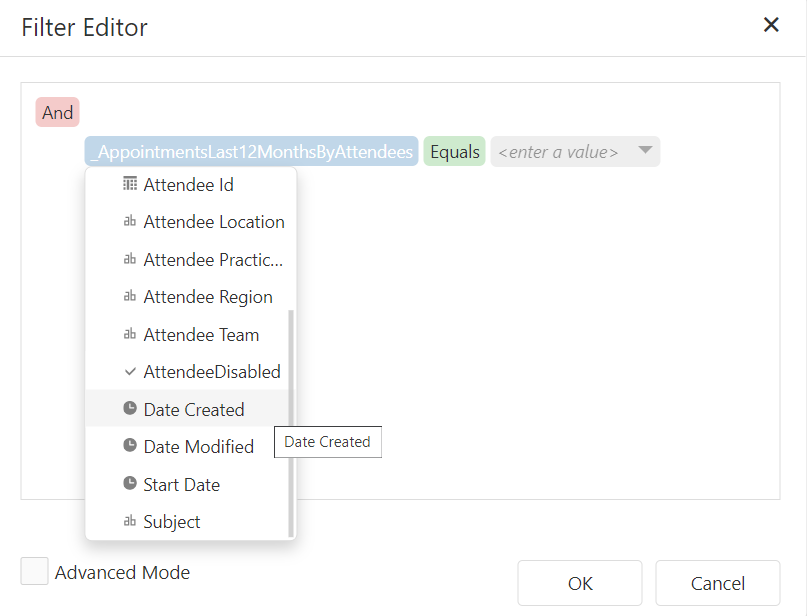
Select a Field from the field chooser and define the operator and conditon you wish to apply to the whole Dashboard.
Click OK to add the filter and then Save to exit the menu and return to the Dashboard in edit mode. This dashboard will now open to only show data based on the condition that you set in the filter.
Note that when using a Master filter in a dashboard means that it cannot be removed without again editing the filter by editing the dashboard. This can only be completed by a System Admin or a dashboard Owner or Editor.