Working with Analytics Dashboards
Overview
Analytics is a premium feature which empowers users with the ability to view, create and share customisable dashboards to visualise the data in their database. The data that is visualised provides near real-time access to insights drawn from data in your database. For performance reasons, your data is cached in a Dashboard for 3 minutes, so some data may not appear immediately.
By permission, users can create dashboards themselves, picking the data, layout and filtering options to their preference and can then choose to share their dashboards with their choice of Professional users within their organisation.
Dashboards can be used to display information captured in such as User Activity, Financial Forecasting, Company Performance, etc to truly deep dive into data in a way that's never been possible before. Several pre-built default dashboards are included displaying this information and are described below.
To learn more and get started with this premium feature, please contact your Account Manager or email inveniassupport@bullhorn.com.
Creating, editing and sharing Analytics Dashboards requires you to either be a System Administrator, to have some of the User Permissions applied for Analytics or, when one of your System Administrators shares a Dashboard with a user, for that user to have been given "Edit" or "Owner" permissions on that Dashboard. If you are an Admin and don't see the Edit button, you are probably viewing a default dashboard. These Defaults can not be edited, so you will first need to click Clone to create a copy and then edit the copy.
This article covers:
- Opening Analytics
- Viewing Different Dashboards
- Filtering in a Dashboard
- Refreshing Data
- Fullscreen Mode and Maximising a Widget
- Sharing a Dashboard
- Creating a Dashboard
- How to Import Dashboards
- Cloning an Existing Dashboard
- Changing the Currency on Dashboards
- Deleting a Dashboard
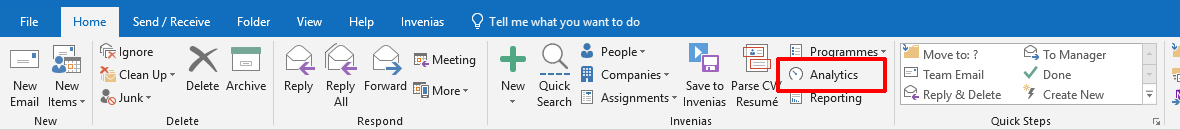
Opening Analytics
Open Outlook, log into (e.g. by opening the People List) and click Analytics in the toolbar as shown below in the desktop application:
And the Essentials web application.
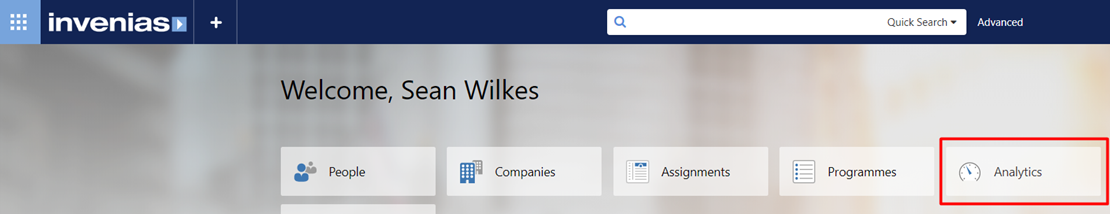
This will open Analytics in your default browser, opening to the last dashboard you viewed:
As you clicked to open Analytics when you were already logged into the Desktop Application will automatically log you into Analytics.
Viewing Different Dashboards
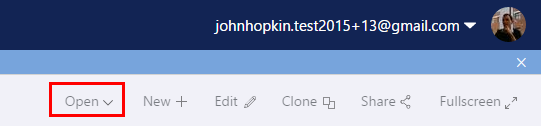
When you first open Analytics, it will open to the previously viewed dashboard. You can select a different dashboard to view by clicking Open:
This will display all dashboards which have been favorited by the current user, alongside an option to browse all dashboards created or shared to the current user:
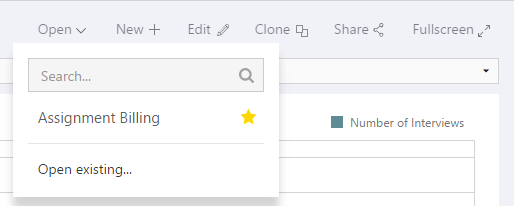
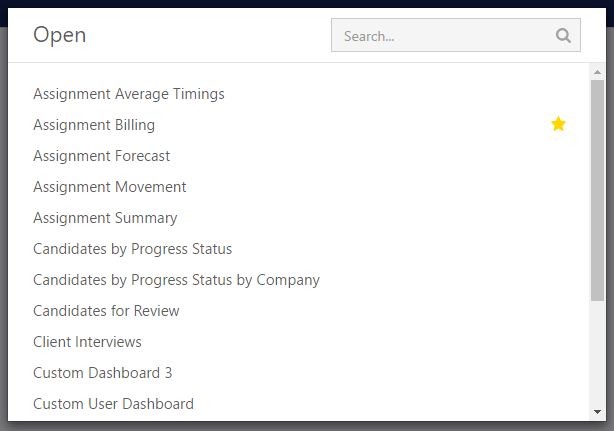
Click on any favorited dashboard (shown with a star) to open it, or use the search box to search for dashboards by name, or click Open Existing to browse a full list of dashboards. Hovering over the location of the favourite star and clicking to enable will add that Dashbaord to your favourites list:
In this window you can favorite/unfavorite a dashboard by clicking into the star icon to the right of the dashboard name.
Filtering in a Dashboard
Dashboards are constructed using a combination of display widgets such as Bar Charts, Scatter Charts, Grids, Filters etc. Depending on the options selected when building the dashboard, the creator may have added additional filtering options on some or all of the dashboard widgets. You can also hard code filters into the whole Dashboards as a Master Filter on the Data Source. Review the Filtering Analytics dashboards article to learn more about adding filters.
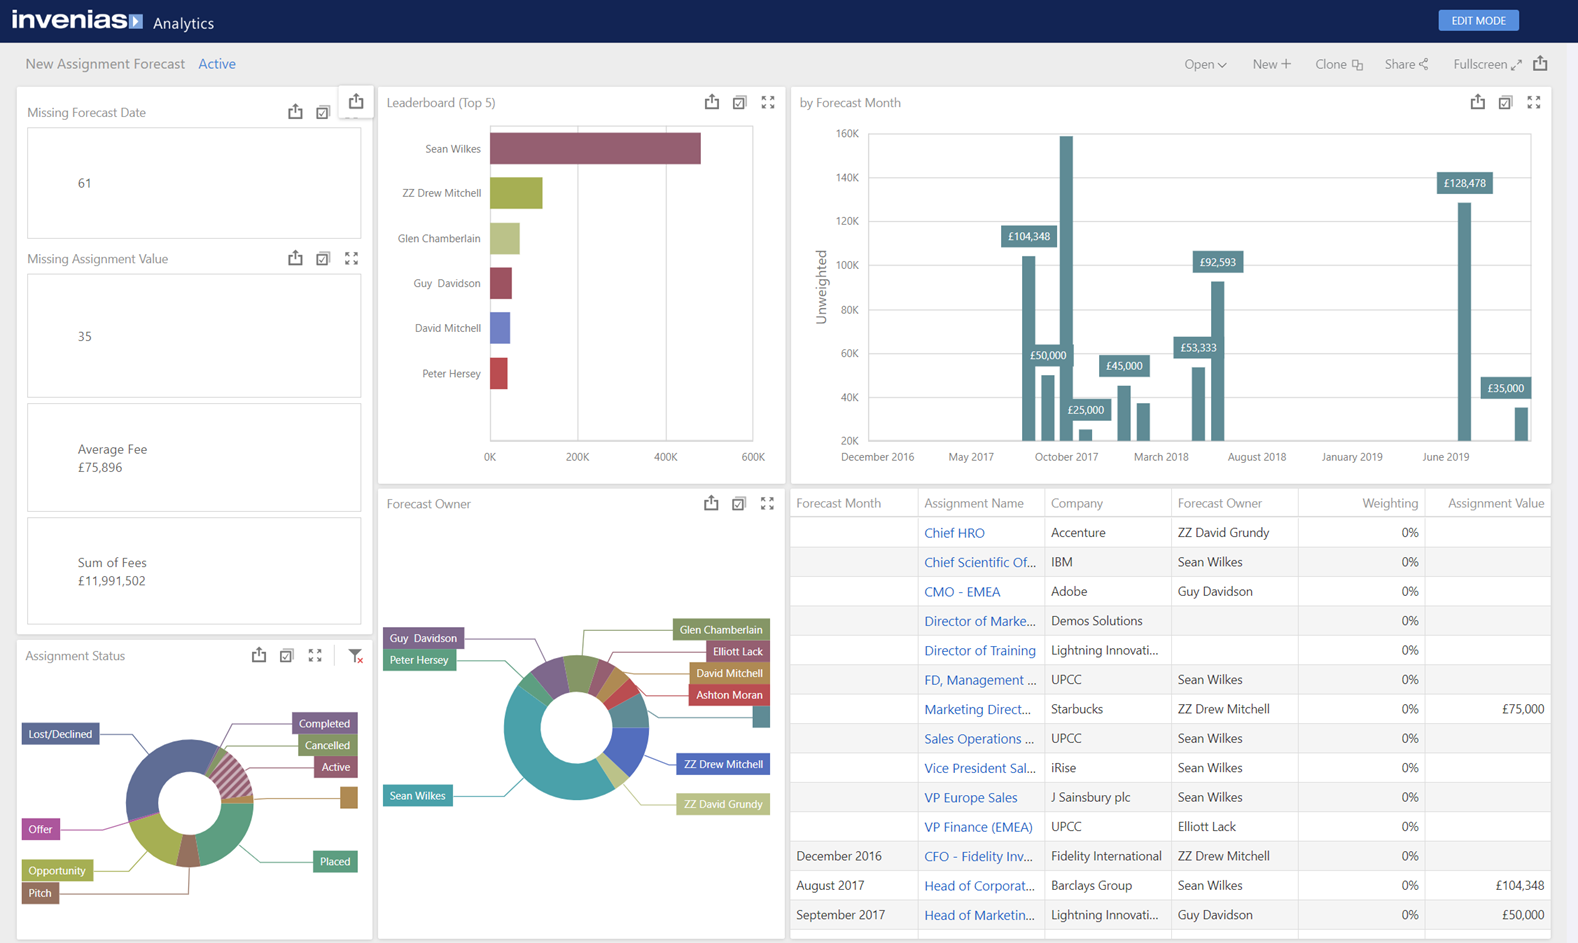
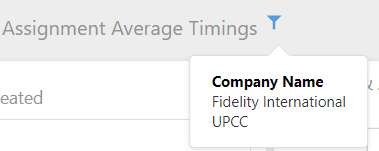
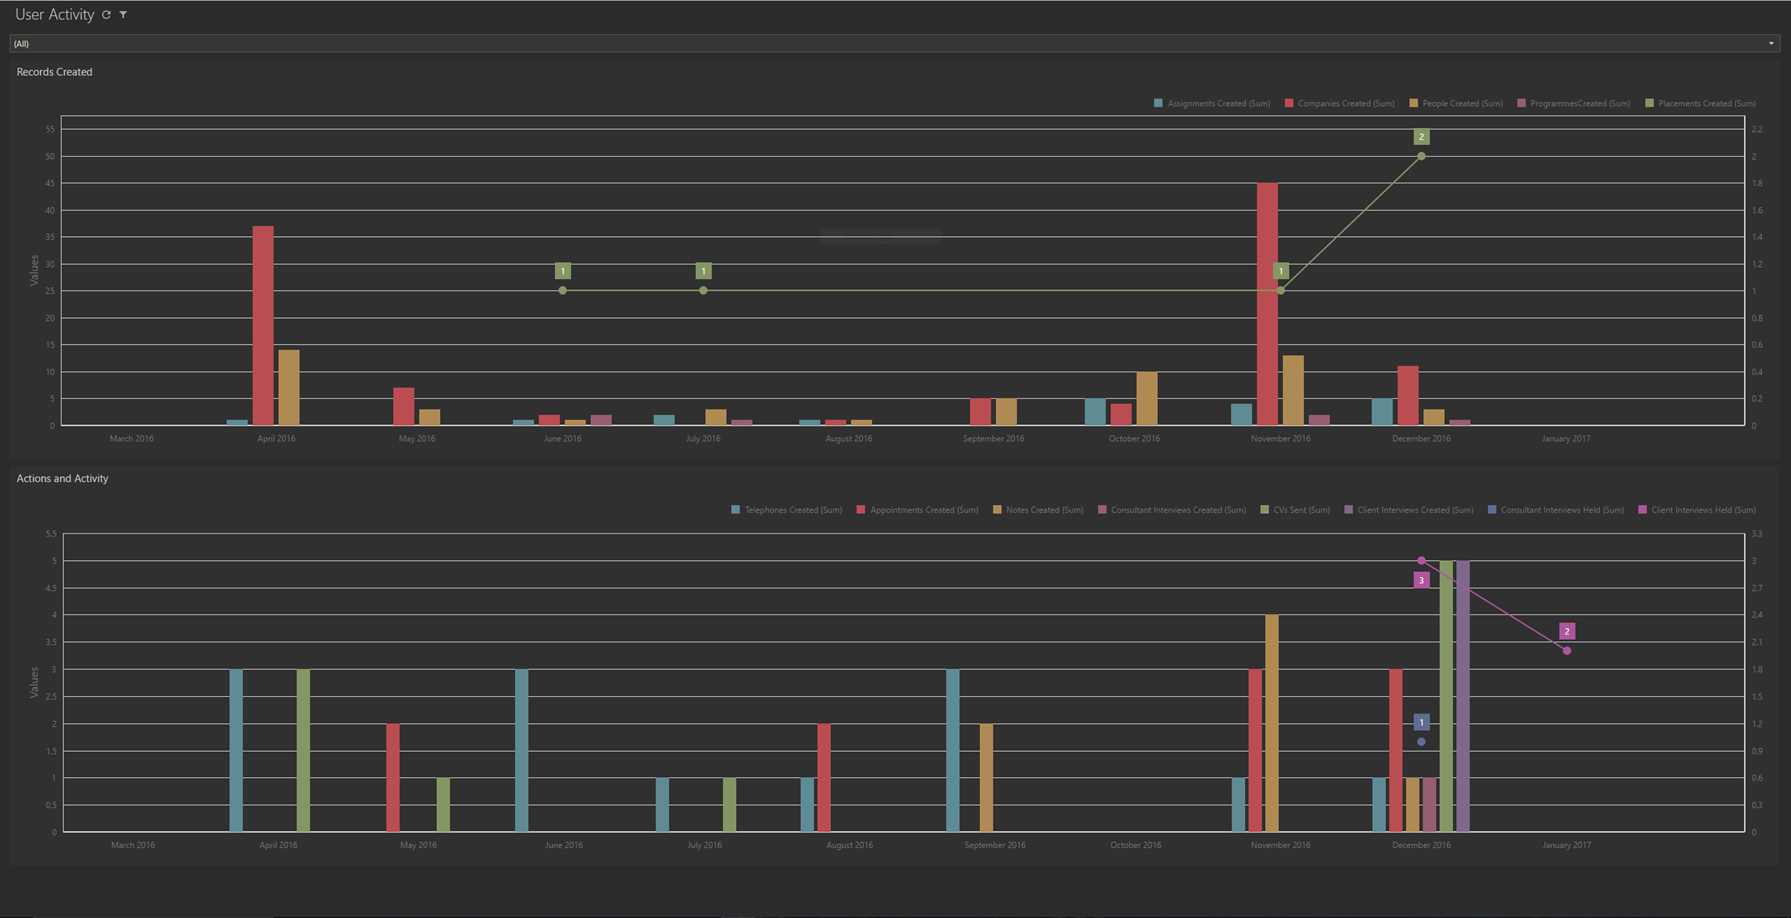
The example below will detail some of the filtering options which can be enabled for a dashboard using the Assignment Average Timings Default Dashboard.
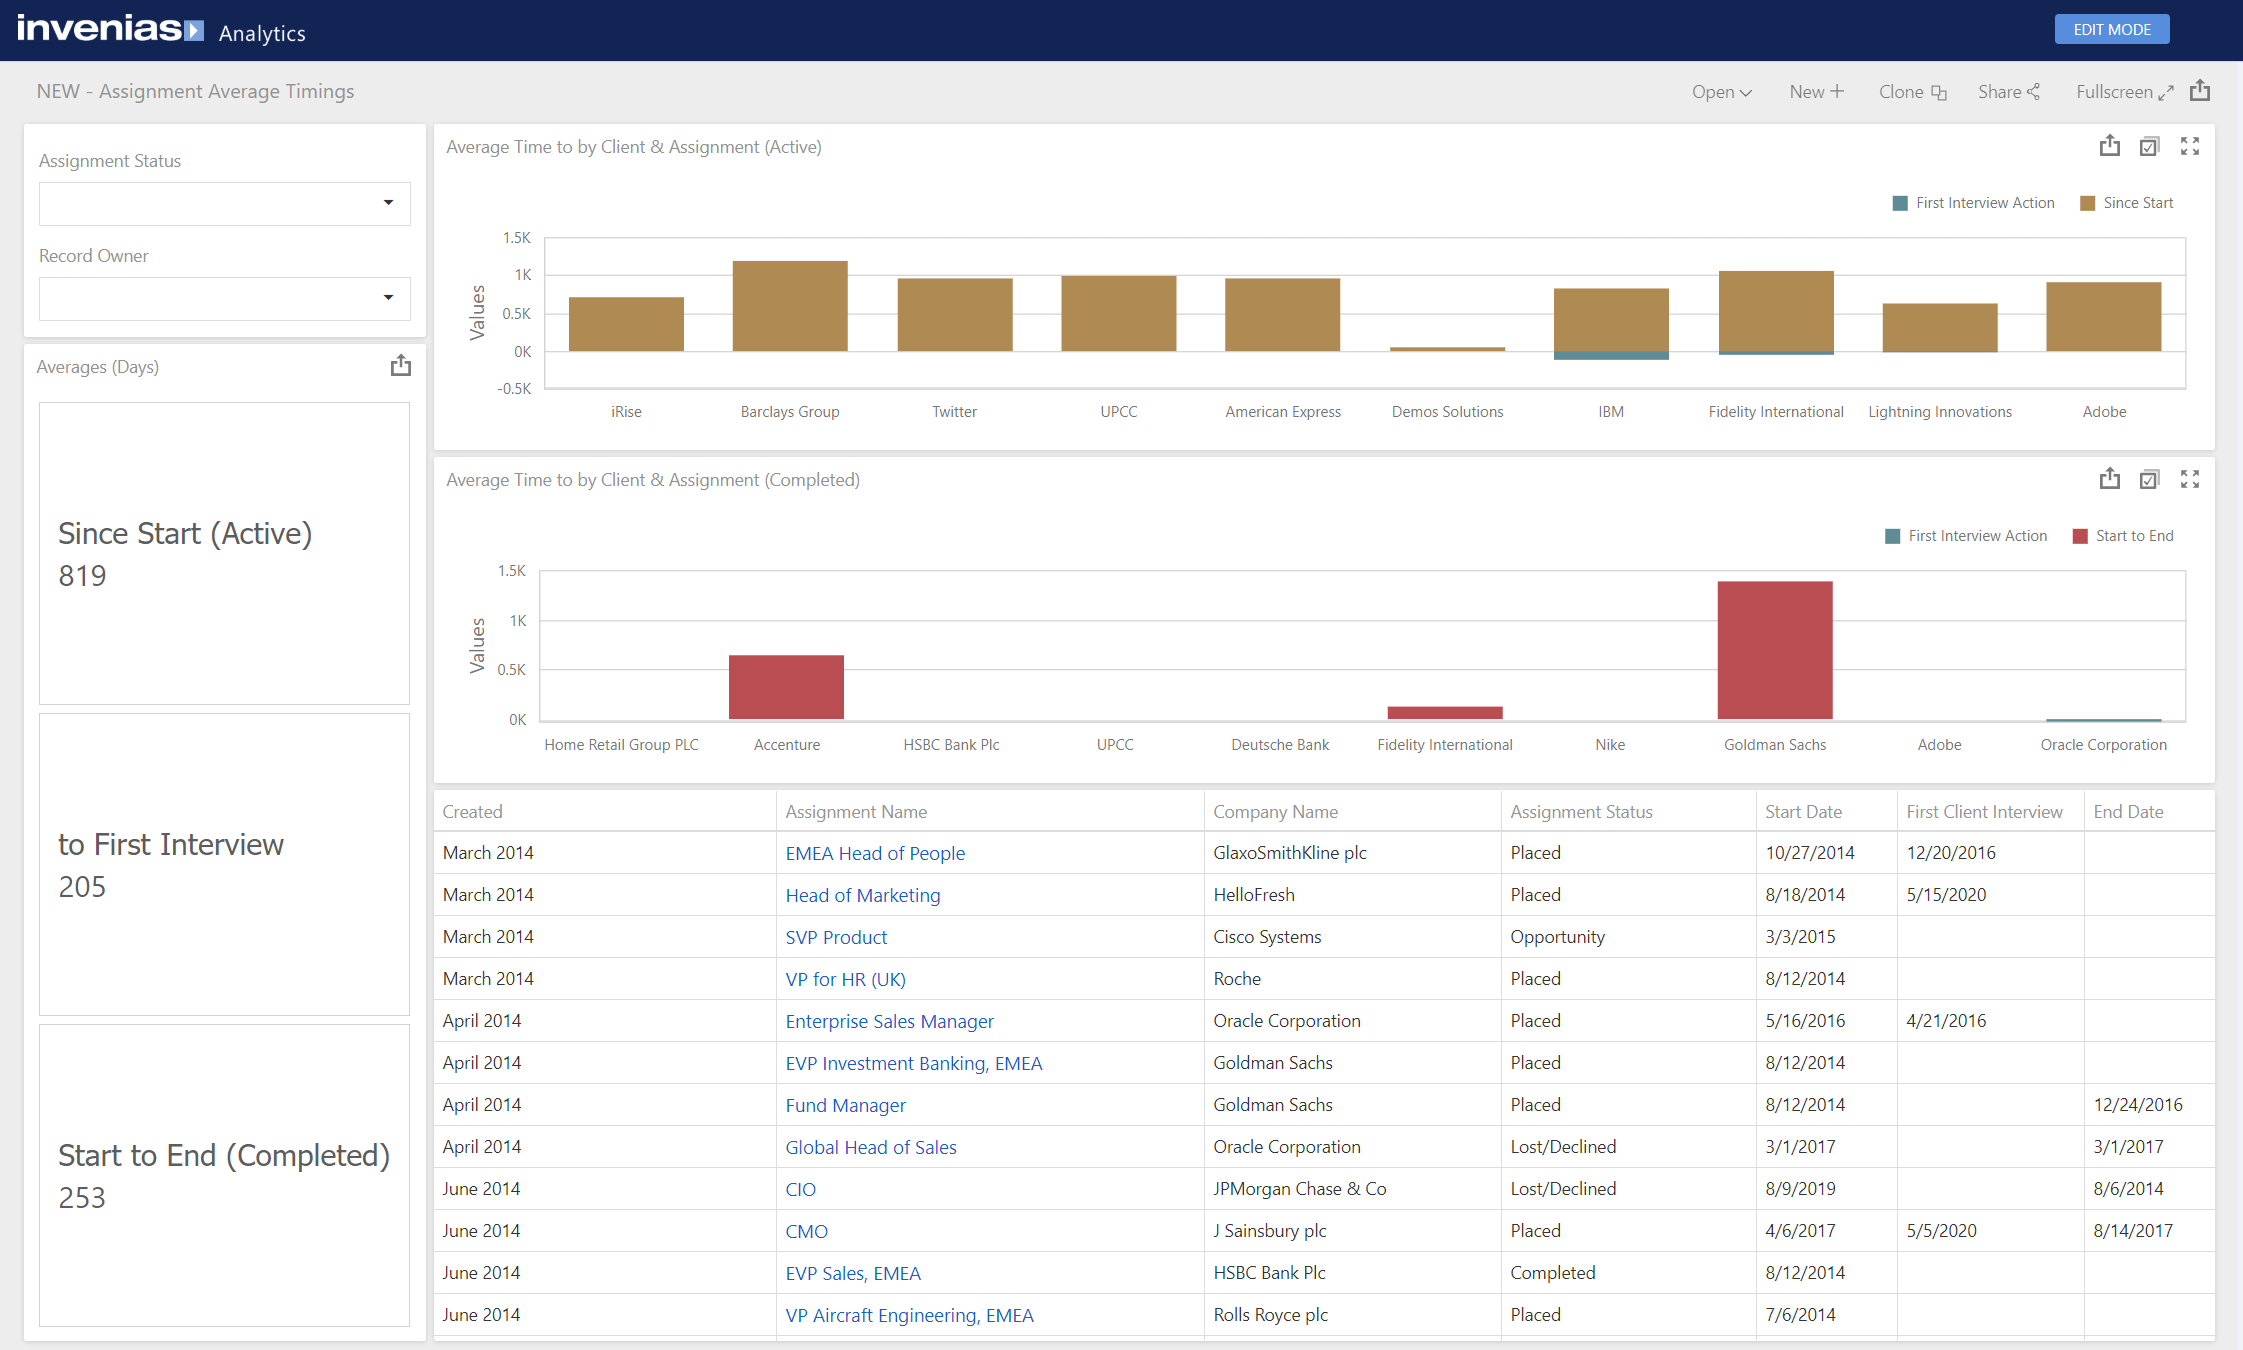
Widgets can be assigned as Master Filters meaning that clicking into the data displayed in the widget will filter some or all of the widgets on the page. The central widget displaying Client Company names acts as a master filter in this dashboard. Single Click on any row will filter the dashboard to only show data from the selected company.
By default, the master filter only filters on a single selection, you can make multiple selections by clicking the multi-select icon, shown when hovering the mouse over the widget:
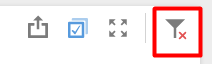
Once a master filter has been applied you can remove it by clicking the icon highlighted below:
Depending on the construction of the dashboard, the creator may have also included drill-down options to dive deeper into a widget. Using the Assignment Timings Dashboard again, double click on any company in the top bar chart widget to drill down into a list of Assignments from this company. Whilst the Multi-Select option is enabled you can not take advantage of drill-downs, so turn the Multi-Select option off first, if it's applied.
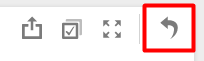
You can return back by clicking the icon below:
Click here to view an article detailing some of the more advanced filtering options that are available for Analytics to filter by dates in the data.
With a filter applied in a Dashboard, the options selected in your filter will appear next to the name of the dashboard. With multiple filters applied you'll need to hover over the filter icon to see these.
Refreshing Data
Note that some data is cached for performance reasons for up to 3 minutes, meaning that dashboards may not display changes made to data via Professional applications for up to 3 minutes after the changes. You may be able to manually refresh the dashboard by clicking the Refresh in the browser.
Fullscreen Mode and Maximising Individual Widgets
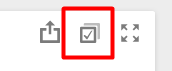
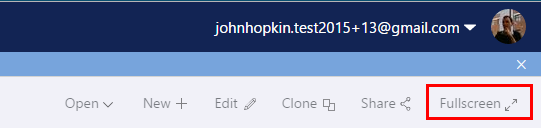
Dashboards can be viewed in fullscreen mode, by clicking Full Screen:
This will open the current dashboard in a new browser tab in fullscreen mode, removing the toolbar and changing the display theme to a theme optimized for displaying on a large screen as shown below:
Sharing a Dashboard
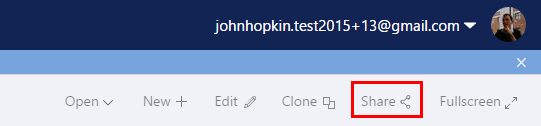
Newly created dashboards are not available to any other users unless the creator chooses to share the dashboard with them. To share a dashboard, open the dashboard you wish to share and click Share:
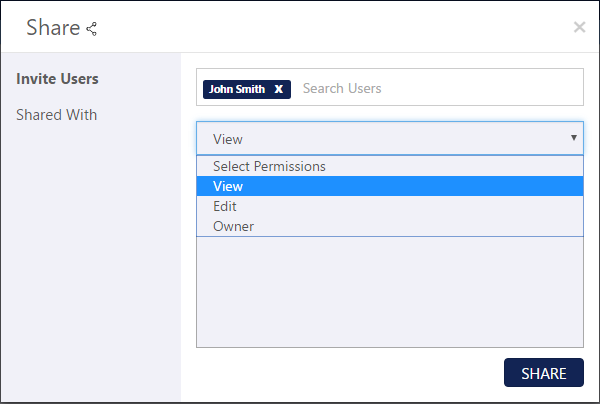
The following window allows a user to choose which Professional users to share this dashboard with and which permissions to grant them:
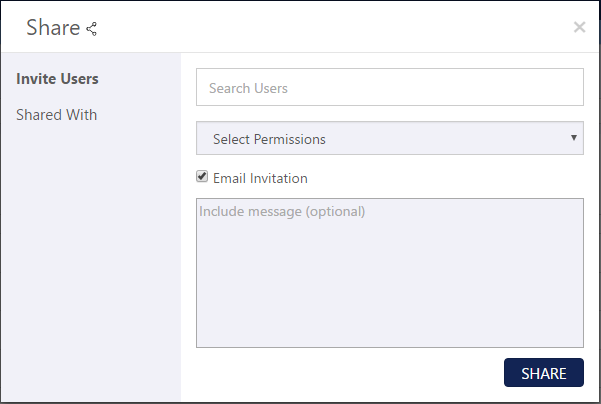
In the Users section, you can choose to add individual users or all users in your company.
Permissions
- View - The selected users can view but not edit or share this dashboard.
- Edit - The selected users can view, edit, but not share the dashboard
- Owner - The selected users can view, edit, delete, and share this dashboard.
Select the users you wish to share this dashboard with, select the permissions for these users and click Share. You can also send an email invitation notifying the user of this dashboard, with the option to include a message:
If you wanted to change permissions for users who you have shared this dashboard with, or stop sharing this dashboard with any user(s), click to the Shared With tab in this window:
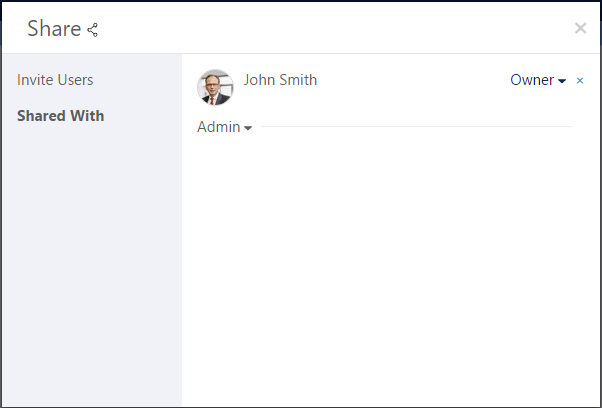
All users whom this dashboard has been shared with will be listed. Click the drop-down next to each user to change their permissions, clicking the X next to the drop-down will stop sharing this dashboard with the selected user.
Creating a Dashboard
Permission Required: Please note, Creating a Dashboard requires the "Create Dashboards" permission.
Click here to view a full guide on how to create a dashboard.
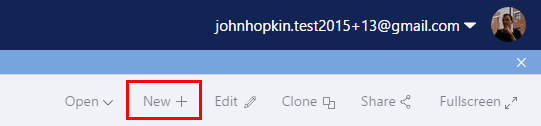
To create a dashboard, open Analytics using any of the routes described above, click New+:
You will be prompted to enter a name, then select the Data Source you wish to use for this dashboard:
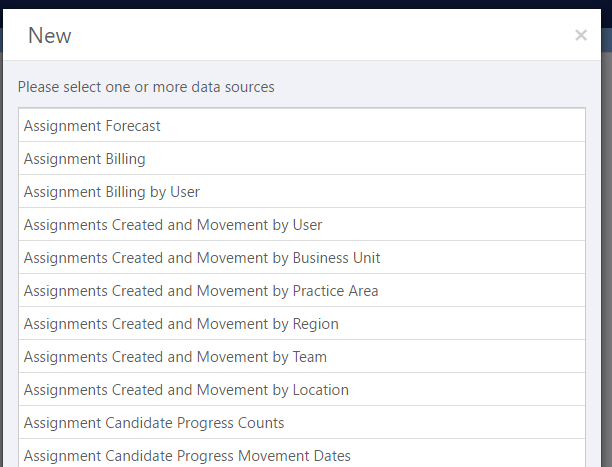
Each Data Source contains an optimized field list which has been designed for use in a specific dashboard.
Importing Dashboards using an XML
Analytics Dashboards can be exported and saved as an XML. There are some examples attached at the bottom of the Other Analytics Dashboards article. To Import a Dashboard you first need to download the XML file for the Dashboard that you wish to import.
Then open Analytics Dashboards and click New+:

On the popup that appears click Import
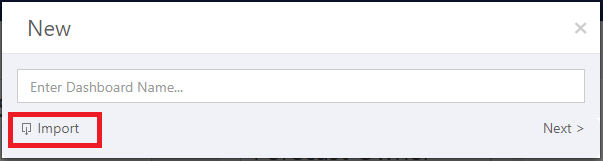
This will open a windows browser where you can select the XML file you wish to import. You'll then be prompted to open the Dashboard you have just imported.
Cloning an Existing Dashboard
Permission Required: Please note, Cloning a Dashboard requires the "Create Dashboards" permission.
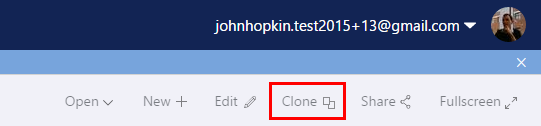
Note that the default dashboards cannot be edited directly, however you can clone any of the dashboards and make edits to the clone. Prior to editing any existing dashboard you may wish to make a copy of the originating dashboard and make your edits on the copy, leaving the original intact. This means if you wanted to revert any changes made you can always delete the unwanted cloned dashboard.
To clone a dashboard, click Clone as below:
Changing the Currency Symbol on a Dashboard
Many of the Data Sources consumed by our Dashboards contain two values relating to financial data. The first is the Actual Value along with the Currency that relates to that value. However, most of our Default Dashboards consume the BASE VALUE. This Value uses the Exchange Rates that you can set on Currencies in Systems Preferences, to convert each currency into a Base Value in your preferred currency. The Preferred Currency is identified in Systems Preferences by setting the Exchange Rate on that Currency to 1.00.
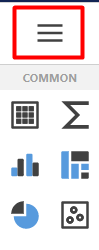
You can change the currency symbol used to visualise data for your Base Value. If you are working with a Default Dashboard, you may have to use the Clone feature first before you can edit. Click EDIT MODE in the Dashboard and click the Hamburger Menu in the Top Right Hand Corner:
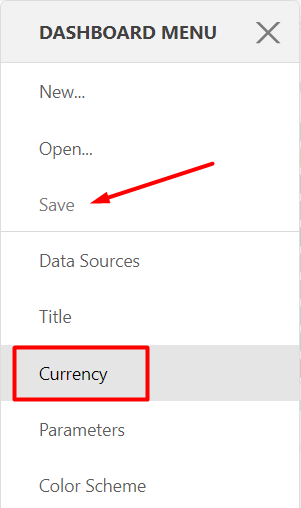
You can set the Currency Symbol that is used on each Dashboard when displaying values as in a Currency Format by clicking the Currency tab in the Dashboard Menu, selecting your preferred currency from the list and clicking Save in the Dashboard Menu to return to EDIT MODE before clicking the FINISH EDITING button to save the changes you've made.
Deleting a Dashboard
To delete a dashboard, you must be the creator of the dashboard, or the dashboard must have been shared with you including the Owner's permission.
Open the dashboard you wish to delete, click Edit, then Delete: