Creating a Dashboard using a Custom SQL Datasource
Overview
This feature has been introduced to allow the creation of Custom Datasources for Analytics Dashboards. A Custom Datasource can be used to create a complex dataset that cannot be created from the existing Default Datasources.
Advanced users with a strong knowledge level of Microsoft SQL and the Invenias abstraction layer can use this feature to create their own datasources by using a SQL Query to target data from across the Invenias abstraction layer. This article will cover this process and is aimed at advanced users only. Details of the Abstraction Layer can be found on the Reporting article.
As this is a very complex topic, the primary user of this functionality is the Invenias Professional Services team. Please contact your Account Manager to discuss engaging our PS team in a custom dashboard project, or email who will route your enquiry to the appropriate team.
If you feel that there are certain fields missing from existing Data Sources, please raise an idea detailing the dataset to the Invenias Ideas Portal.
This article covers:
Creating a Dataset using a SQL Query
Log into the Analytics application and open an existing dashboard, or create a new dashboard, then click Edit:

Permission Required: Please note, Creating a Dashboard requires the "Create Dashboards" permission. To edit an existing Dashboard, you must be the Dashboard Owner.
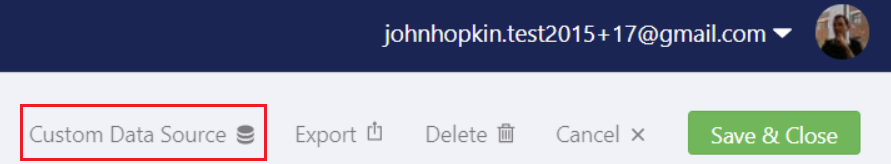
Once in Edit mode, click Custom Data Source:
This following Window opens:
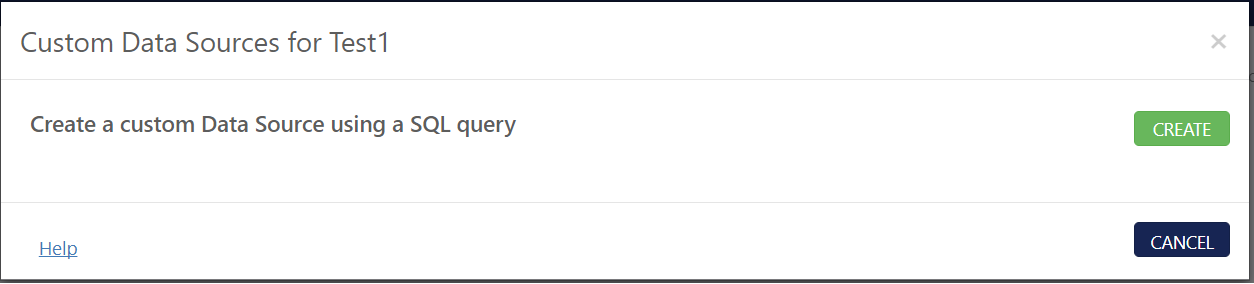
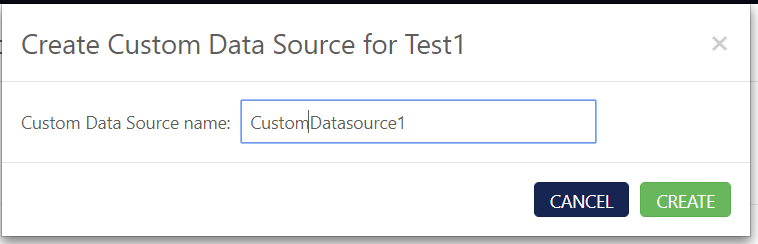
Click Create and give your DataSource a title (containing no spaces) e.g. CustomDataSource1:
You can then add your SQL Query into the Query window for the Data Source:
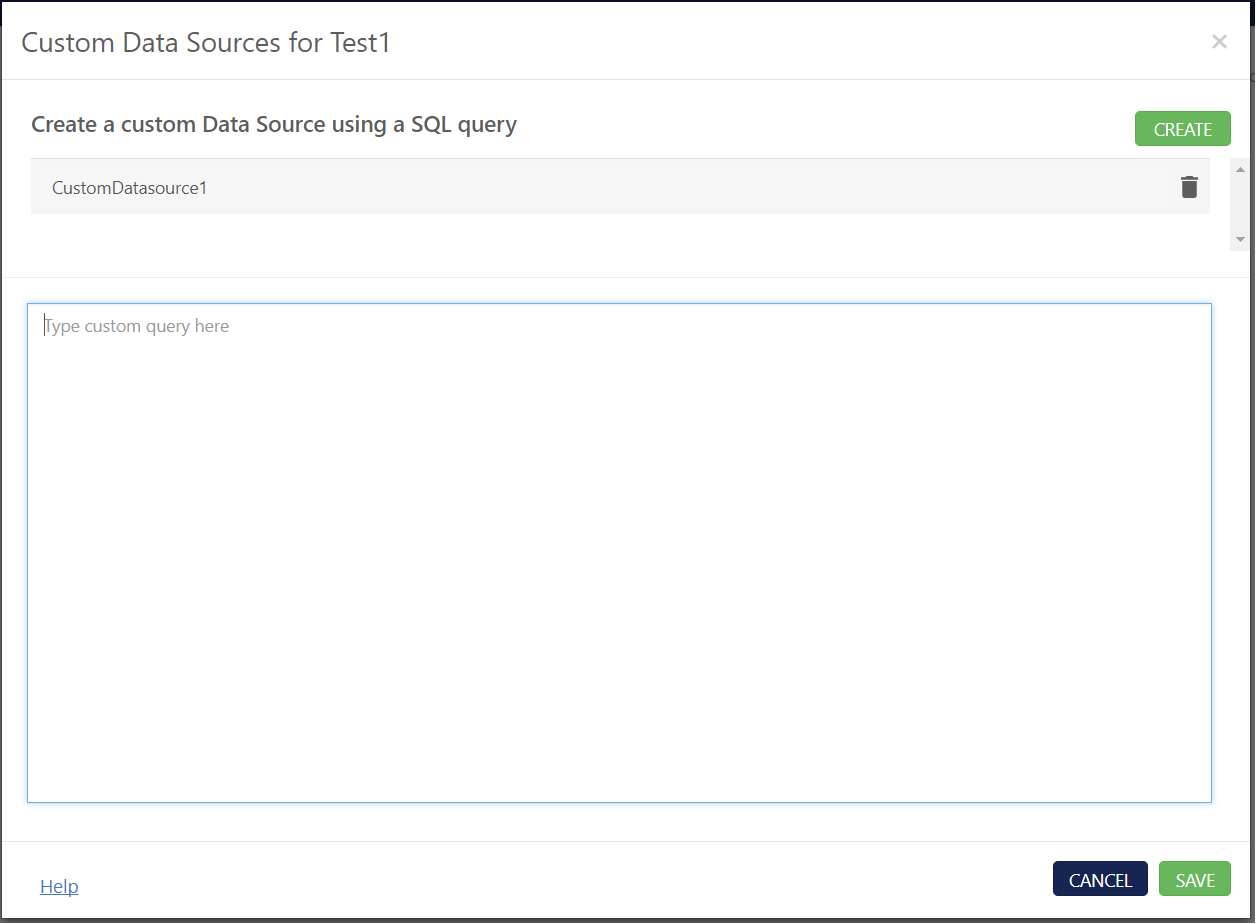
An example query would be: Select * FROM PeopleView
Click here for a document listing all available Invenias abstraction layer views. When you click SAVE, Invenias will format and validate the query.
You can add multiple queries and edit existing queries from this menu.
Selecting the Dataset in your Dashboard
After you have added a Query, you will need to SAVE & CLOSE the current Dashboard, then enter Edit mode again.
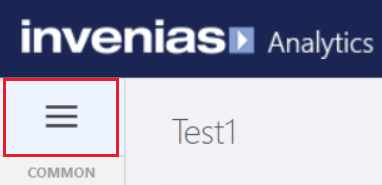
In edit mode, you can now select the Datasource you added earlier in the Dashboard by clicking into the Menu icon in the Top left of the screen:
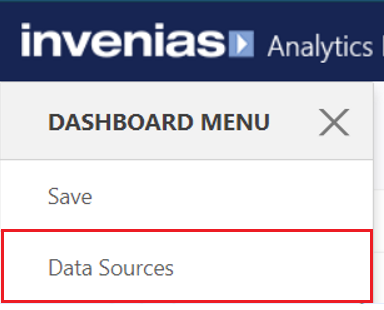
Then click Data Sources:
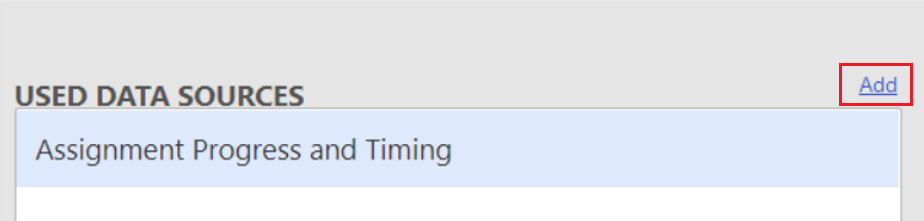
Click the Add Button:
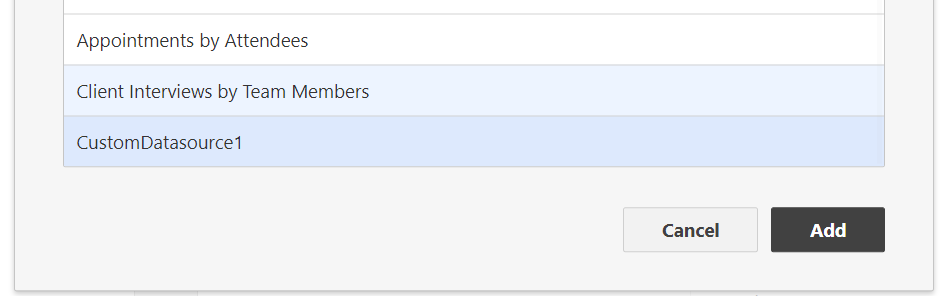
Scroll down through the list of available Data Sources and click to select the Custom data Source you added earlier, then click ADD:
You will then see the datasource selected in the Used Data Sources section. When the row is highlighted, the preview section on the right side of the page will display a list of all of the fields which have been produced as part of the query.
Click Save to exit this menu and return to Edit mode.
You can now select the data source in any widgets added to this dashboard. To do this, select any widget, then click the settings cog and then Data / Filtering:
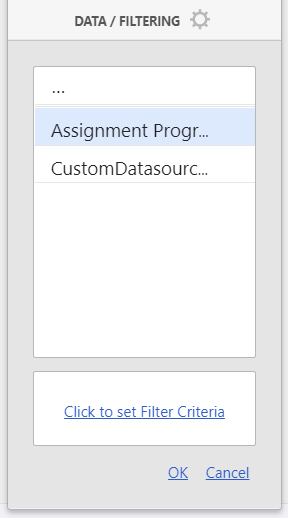
You can now select the Data Source you added for this widget, and bind the relevant fields to this widget in the same way as using any other Data Source.