Other (Prototype) Analytics Dashboards
Overview
Invenias make enhancements to products on a regular basis in line with this we may also create additional dashboards that are useful for all our clients they can be imported and used with the Analytics feature.
This article provides those dashboards and instructions on how to import
The Dashboard XML Import files supplied in this Help Article have been created as prototypes and have not therefore been fully tested on real data sets and live customer databases. We, therefore, can't guarantee the performance or functionality of these dashboards and we can not offer support for them if they don't work as expected. These prototypes are designed to give you a framework around which you could have conversations with our Partners on the development of custom Dashboards.
This article covers:
- How to Import a Dashboard
- Track Record of Assignments by Category and Location
- Data Privacy Updates
- Milestones and Team Members
- Fee Splits
- Simple Placements
- Movers - Position Tracking
- XML File Downloads
How to Import a Dashboard
To Import a Dashboard you first need to download the XML file for the Dashboard that wish to import. The XML files for the Dashboards outlined in this Help Article are at the bottom of the article.
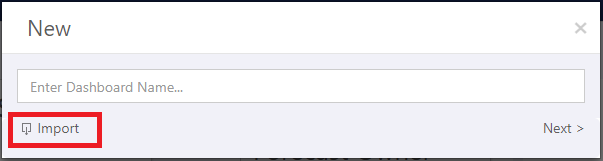
Then open Analytics Dashboards and click New+:

On the popup that appears click Import
This will open a windows browser where you can select the XML file you wish to import. You'll then be prompted to open the Dashboard you have just imported.
Track Record on Assignments by Category and Location
You need to be using the Company Location data in Assignments and have our Premium Proximity Service enabled in order to be able to leverage the mapping feature in this dashboard.
The Proximity Service geo-codes every Location address in the database, which allows us to place points on the maps to show where in the world those Assignments were located. The Position Function & Industry Categories filters may need editing once imported to work with your preferred Categories. The Name/Company filter has the searching feature enabled so you can search by the Assignment Name or Company Name on Assignments to filter the dashboard. The Pie Charts are configured to cluster for an area. Use the full-screen mode on the map widgets and the scroll on your mouse to zoom in and expand the clusters.
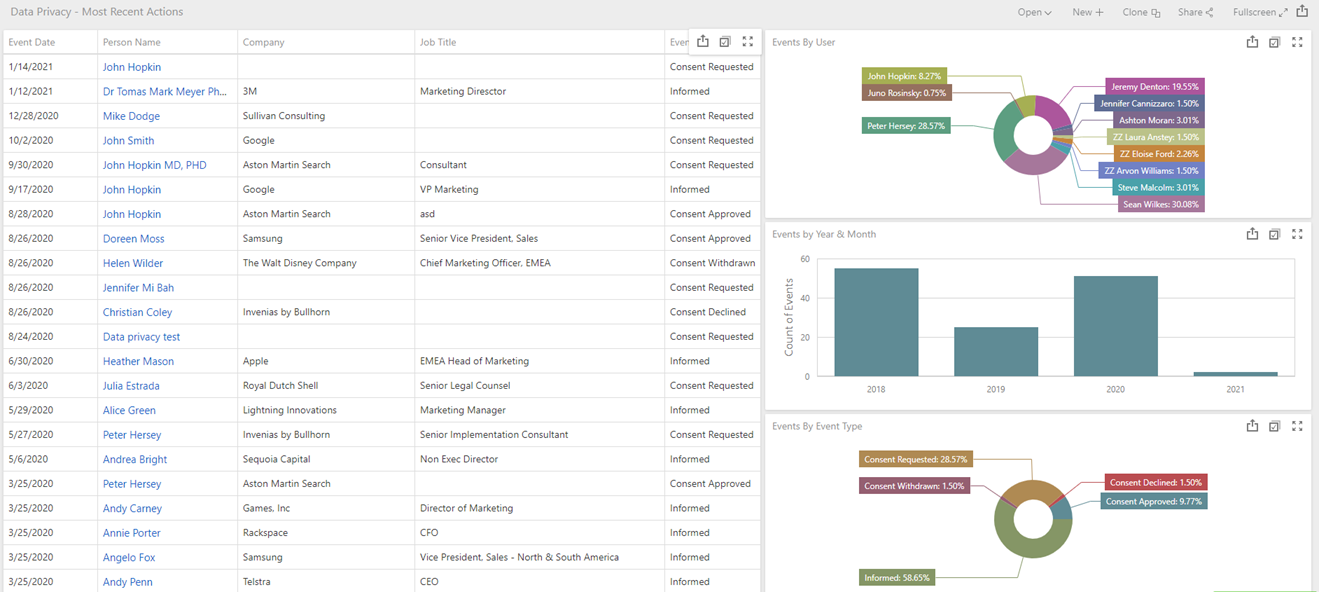
Data Privacy
This dashboard shows the most recent Data Privacy Action taken against all People in your database, what action was taken, the date of that action and which User took it. The Charts and the Grid can all be used as Filters. There is a Drilldown on the Bar Chart "Events by Year and Month" to drill into the Monthly view from the Yearly View.
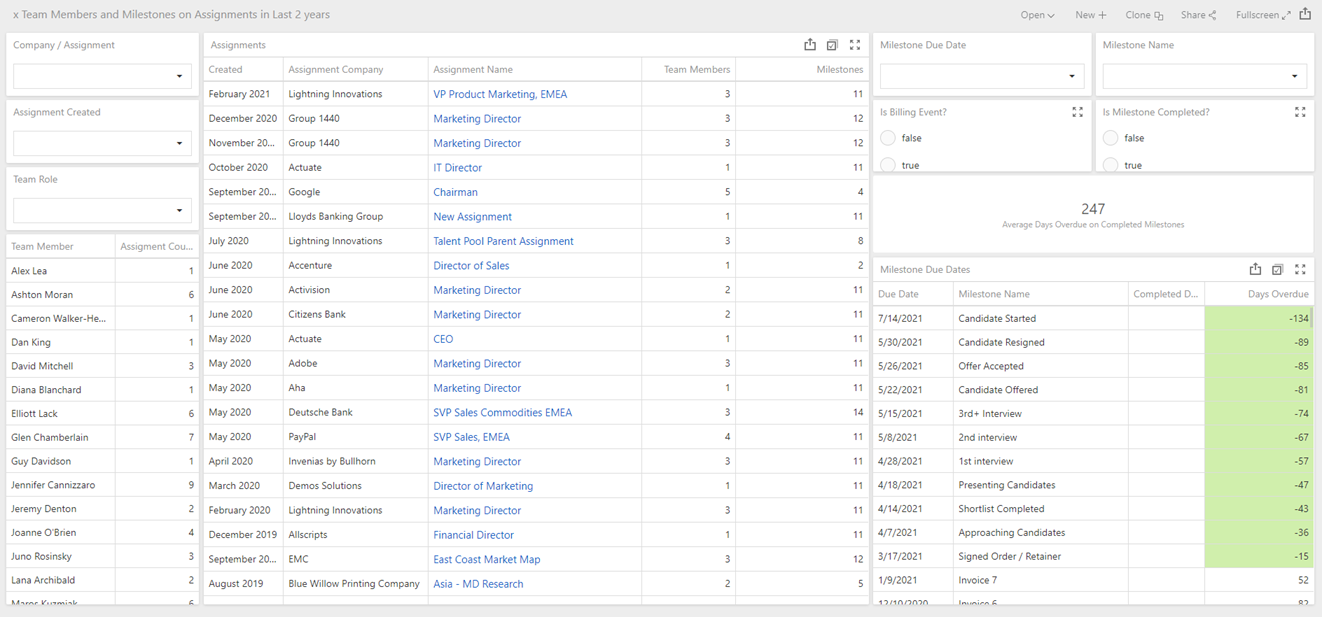
Milestones and Team Members
This dashboard visualises all Assignment Milestones with Due Dates and Completed Dates and allows you to select Assignments where specific Users are members of the Team. The calculation for "Days Overdue" is based on the difference between the Due Date and today's date (if the Milestone is not in a Completed) or the difference in days between the Due Date and the Completed Date (if the Milestone is Completed). Conditional Formating has been applied to the "Days Overdue" columns, highlighting anything in green if the value is less than or equal to 14 days.
Filters have been included to allow you to select specific Team Member Roles, Milestone Names, Date Created fro the linked Assignments and whether Milestones are Completed and/or are Billing Events. All of the grids (Team Member, Assignments and Milestones) also operate as filters.
Fee Splits
This Dashboard consumes the Assignment Billing by Team Member data source displaying the Billing Events based on the Base Value of those events, meaning these are all converted into the currency that you have set with a 1.0 exchange rate in Systems Preferences.
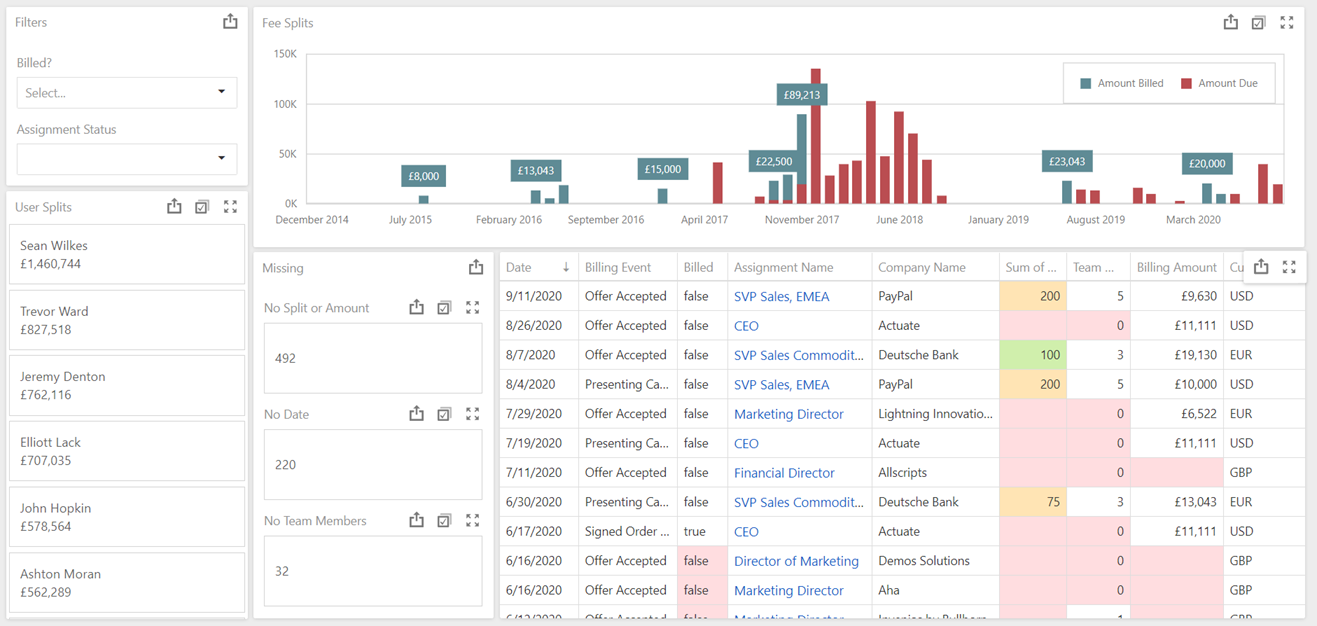
The complexity of displaying Billing data based on fee splits comes from the fact that there is no logic in Invenias, either limiting you to 100% or forcing you to add 100% on each Assignment. This means that even if you've added billing events, the sum of the allocated splits can differ from the billing amount. We have therefore incorporated components in this dashboard to support auditing fee split amounts and identify Assignments that have missing team members or fee allocations.
The User Splits cards SUM the Fee Allocation (in the Base Currency) for each Team Member.
Conditional Formating has been applied to the Billed column in the grid to show in red the Billing events that have not been billed (false) where the Due Date is in the past. We have also applied conditional formating to the Fee Splits, Team Members and Billing Amount columns to show potential issues with this data.
Simple Placements
This dashboard simply displays counts of the number of Offer or Placement records broken down by the Start Date, Creator, Owner and Placed By data on those Records.
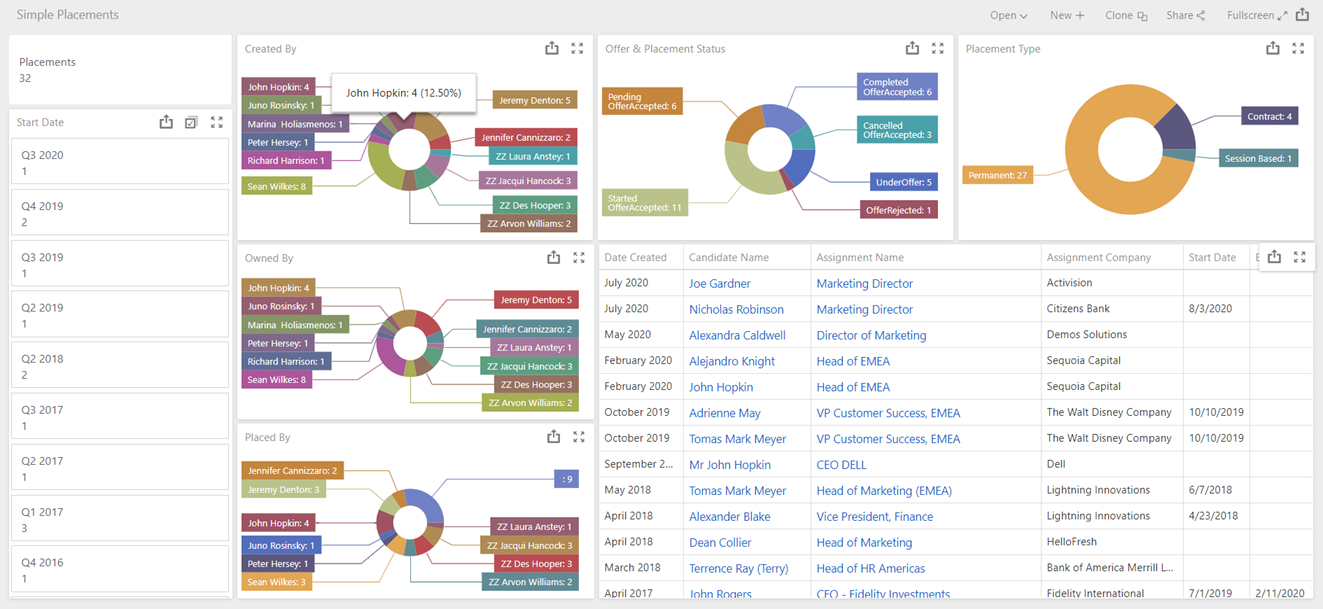
All Pie Charts and the Start Date Cards (by Quarter) all operate as filters to the Dashboard. The hyperlinks will open the Placement (from the Candidate Name column) and the Assignment using the Desktop Application.
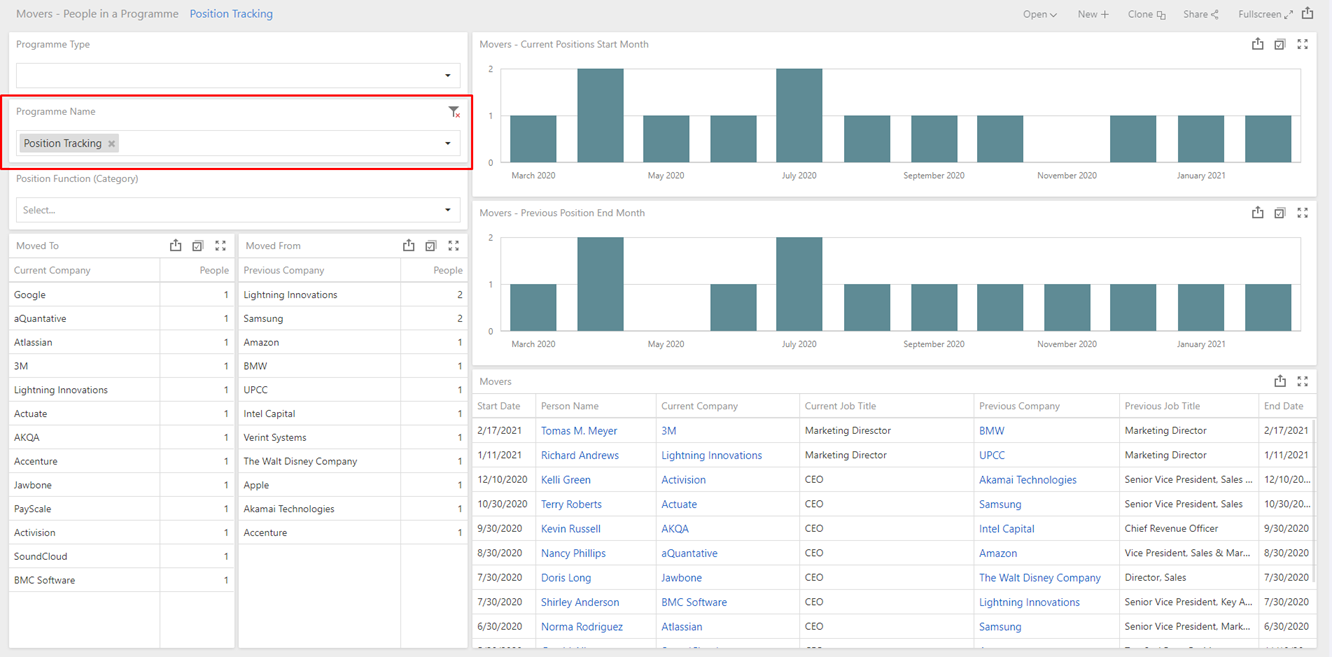
Movers - Position Tracking
This Dashboard is built to consume lists of People who have been added to Programmes so that you can analyse their most recent position changes by Date and Company. The concept is that you run a search of the database to find all People who meet certain criteria (e.g. Categories, work for Companies in Portfolio of another Company etc) and you add all those People to a specific Programme before then filtering by that Programme using the "Programme Name" filter in this Dashboard. The Moved To data relates to the Company on their Default Position, assuming that this position has a Start Date in the last 12 months. The Moved From data relates to the Company on their most recent Previous Position. The Start Date of Current Positions and the End Date of Previous Positions are visualised in the Bar Charts. All the widgets except for the grid work as a Filter. The grid then contains hyperlinks to open Invenias Desktop Records for the Person, Current Company and Previous Company.