Creating a Recruiter Activity Report
The following instructions will help you to create a report in Bullhorn Reporting that shows you the Fill Rate, Hit Rate, various average times and percentages for your recruiters in your desired department.
Adding the Count Columns
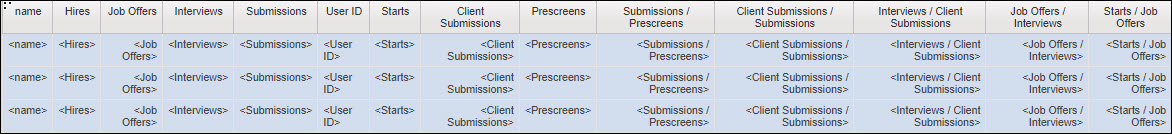
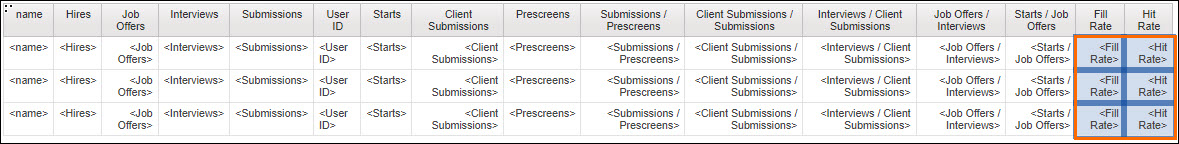
We are working in the User Activity Analysis package since it contains the fields that we desire in our report. We’re adding fields as you see listed in the above image, however you can select other fields as desired to customize your own report.
Steps
- Create a List Report by following the steps in this article: Building and Customizing a List Report in Bullhorn Reporting (Previously Canvas)
- In Insertable Objects, under the Sources tab, expand User Activity Analysis > User.
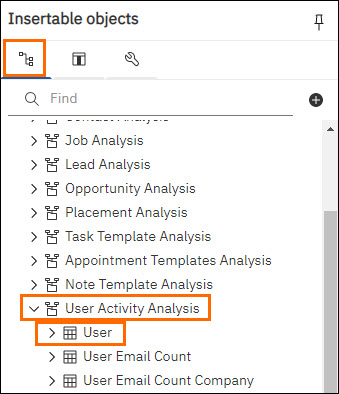
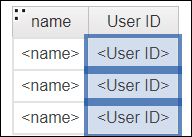
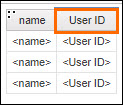
- Double-click Name and UserID to add them to the table.
- We added the UserID to ensure recruiters with the same name will have separate rows on the report. However, we don’t want to see that column, so we’ll hide it next. If you don’t have recruiters with similar names, you can skip adding the UserID and the rest of the steps in this section.
- On the table, select the <User ID> rows.
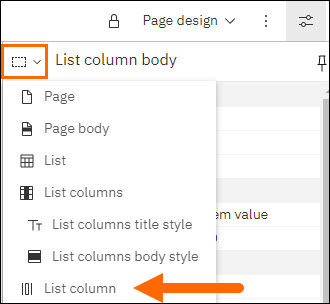
- In the Show Proprieties,click the Select ancestor and select List Column.
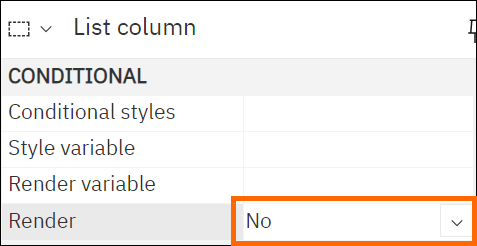
- In the Show Proprieties, under the Conditional section, select Render and choose No.
- This will hide the column from view on the report.
- This will hide the column from view on the report.
Adding Note Counts
To show the number of prescreens, which are indicated in the system as a note type, we will add in the note count and then edit the expression for the field so that only notes with a type of prescreen are counted.
Steps
- In the table, click the User ID column.
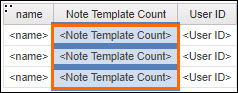
- Still under Insertable Objects > Sources > User Activity Analysis, click Note Template Added > Note Template.
- Double-click Note Template Count to add it to the table.
- In the table, double-click the data rows for Note Template Count.
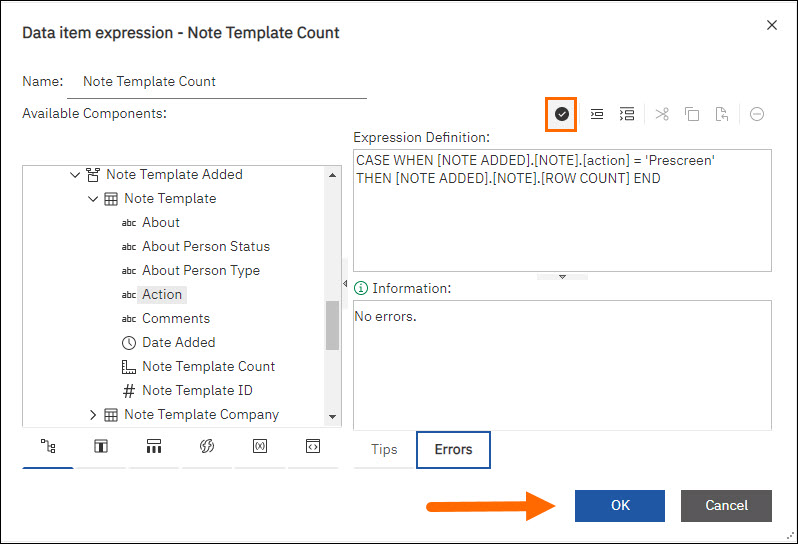
- In the Data item expression - Note Template Count pop-up, in the Expression Definition box, place your cursor at the beginning of the prepopulated expression and type “CASE WHEN "
- Make sure to include the space after WHEN.
- Place your cursor after that space.
- Under Available Components expand User Activity Analysis > Note Template Added > Note Template.
- Double-click Action to add it to the Expression Definition.
- Your cursor should be right after [action]. Leave it here and type " = ".
- Make sure to include the space before and after the =.
- Still under Available Components > User Activity Analysis > Note Template Added > Note Template, right click Note Action and choose Select Value….
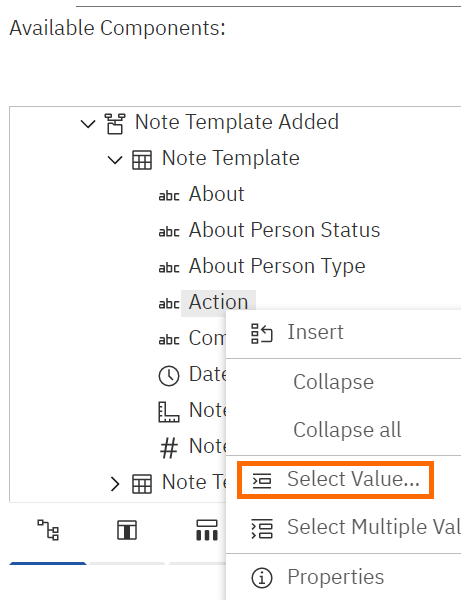
- In the Select Value pop-up, enter “Prescreen” into the Find field and click Search.
- Double-click Prescreen.
- Place your cursor after ‘Prescreen’. Press Enter on your keyboard and then type “THEN ”.
- Make sure to include the space after THEN.
- Place your cursor at the very end of the expression, after [ROW COUNT], and type “ END”.
- Make sure to include the space before END.
- The expression should look like this:Copy
CASE WHEN [Note ADDED].[Note].[action] = 'Prescreen'
THEN [Note ADDED].[Note].[ROW COUNT] END- Query Definition: If the note type is 'Prescreen', add to the count.
- Click Validate.
- Fix any errors that come up.
- Click OK.
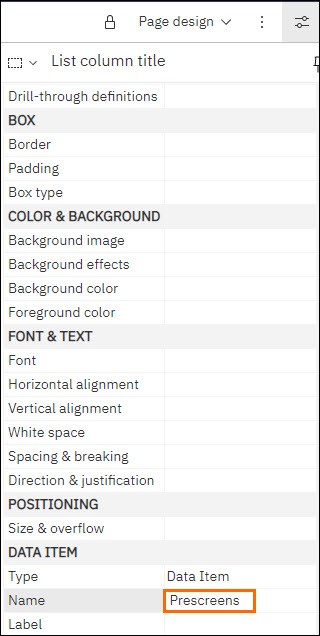
- In the table, select the column header for Note Template Count.
- In the Show properties, under Data Item in the Name field, enter "Prescreens".
- Still under Insertable Objects > Sources > User Activity Analysis, click Submission Added > Submission.
- Double-click Submission Count.
- In the table, click the Submission Count column header.
- In the Show properties, under Data Item in the Name field, enter "Submissions".
- Still under Insertable Objects > Sources > User Activity Analysis, click Client Submission Added > Client Submission.
- Double-click Client Submission Count to add it to the table.
- In the table, click the Client Submission Count column header.
- In the Show properties, under Data Item in the Name field, enter "Client Submissions".
- Still under Insertable Objects > Sources > User Activity Analysis, click Interview Owned > Interview.
- Double-click Interview Count to add it to the table.
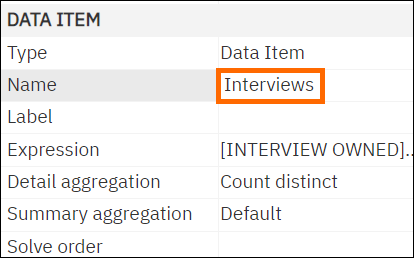
- In the table, click the Interview Count column header.
- In the Show properties, under Data Item in the Name field, enter "Interviews".
Adding More Count Columns
To view the number of job offers a recruiter has extended, we want a column that will count submissions where the status is or was previously set to “Offer Extended”.
Steps
- Still under Insertable Objects > Sources tab > User Activity Analysis, click Submission Added > Submission.
- Double-click Submission Count to add it to the table.
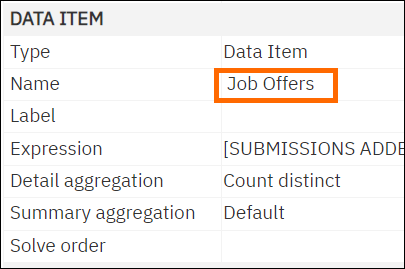
- In the table, click the Submission Count column header.
- In the Show properties, under Data Item in the Name field, enter "Job Offers".
- Double-click the data rows for Job Offers.
- In the Data item expression - Job Offers pop-up, in the Expression Definition box, place your cursor at the beginning of the prepopulated expression and type “CASE WHEN "
- Make sure to include the space after WHEN.
- Place your cursor after that space.
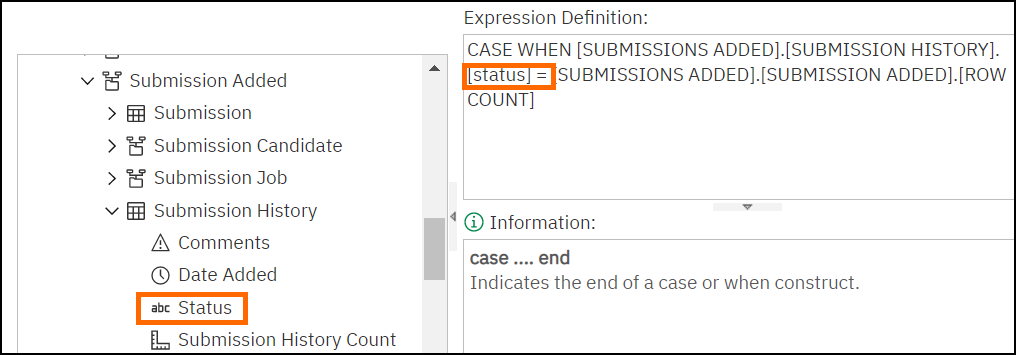
- Under Available Components click User Activity Analysis > Submission Added > Submission History.
- Double-click Status to add it to the Expression Definition.
- Your cursor should be right after [status]. Leave it here and type " = ".
- Make sure to include the space before and after the =.
- Make sure to include the space before and after the =.
- Still under Available Components > User Activity Analysis > Submission Added > Submission History, right-click Status and choose Select Value….
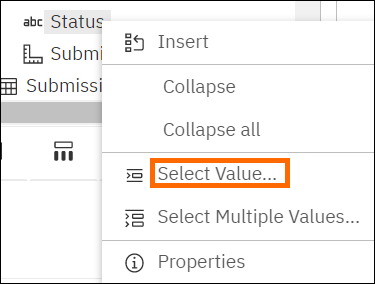
- In the Select Value pop-up, enter “Offer Extended” into the Find field and click Search.
- Double-click Offer Extended.
- Place your cursor after ‘Offer Extended’. Press Enter on your keyboard and then type “THEN ”.
- Make sure to include the space after THEN.
- Place your cursor at the very end of the expression, after [ROW COUNT], and type “ END”.
- Make sure to include the space before END.
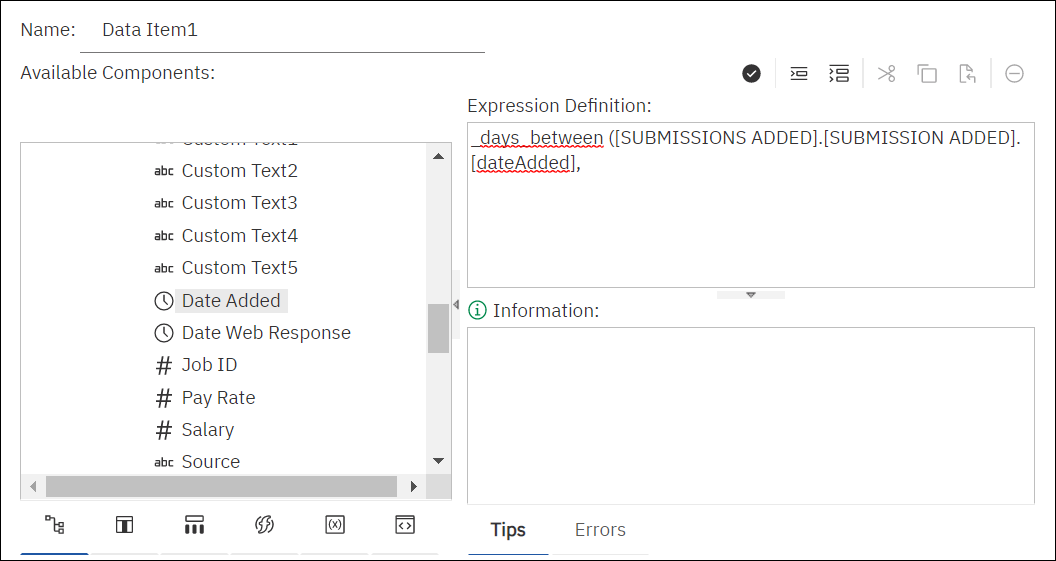
- The expression should look like this:Copy
CASE WHEN [SUBMISSIONS ADDED].[SUBMISSION HISTORY].[STATUS] = 'Offer Extended'
THEN [SUBMISSIONS ADDED].[SUBMISSION ADDED].[ROW COUNT] END - Click Validate.
- Fix any errors that come up.
- Click OK.
- Still under Insertable Objects > Sources tab, click Job Analysis > Job Placement.
- Double-click Placement Count twice.
- We will be adding two placement count columns, one for Hires and one for Starts. Starts are placements that are currently or were previously approved.
- In the table, click the Placement Count column header.
- In the Show properties, under Data Item in the Name field, enter "Hires".
- In the table, click the Placement Count1 column header.
- In the Show properties, under Data Item in the Name field, enter "Starts".
- Double-click the Starts data rows.
- In the Data item expression - Starts pop-up, in the Expression Definition box, place your cursor at the beginning of the prepopulated expression and type “CASE WHEN "
- Make sure to include the space after WHEN.
- Place your cursor after that space.
- Under Available Components click User Activity Analysis > Job Owned > Job Placement.
- Double-click Status to add it to the Expression Definition.
- Your cursor should be right after [status]. After [status] type “ = ‘Approved’” and then press Enter on your keyboard.
- Make sure to include the space before and after the =.
- With your cursor placed at [PRESENTATION VIEW], type “THEN ”.
- Make sure to include the space after THEN.
- Place your cursor at the very end of the expression, after [ROW COUNT], and type “ END”.
- Make sure to include the space before END.
- The expression should look like this:Copy
CASE WHEN [JOB OWNED].[JOB PLACEMENT].[status] = 'Approved'
THEN [PRESENTATION VIEW - JOB ANALYSIS].[JOB PLACEMENT].[ROW COUNT] END - Click Validate.
- Fix any errors that come up.
- Click OK.
Creating the Calculations Using Columns
We will be creating 10 calculations for our report, including:
- Submissions/Pre-Screens
- Client Submissions/Submissions
- Interviews/Client Submissions
- Job Offers/Interviews
- Starts/Job Offers
- Fill Rate
- Hit Rate
- Avg Time to Internal Submit
- Avg Time to Client Submit
- Avg time to Fill
The first five of these are simple division and they will all follow the same steps.
It’s important to note that the order in which you highlight the columns matters since inputs the first column selected as the dividend and the second column as the divisor.
Steps
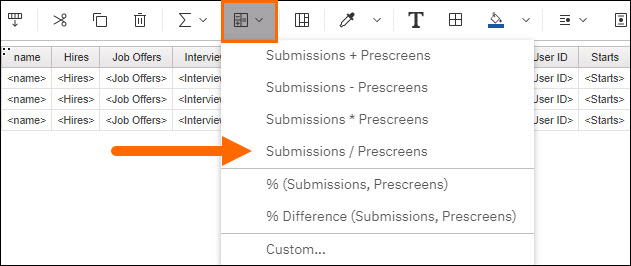
- Using CTRL on your keyboard click the table's column headers for Submissions and then Prescreens.
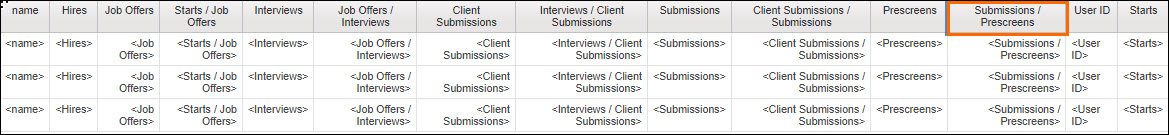
- Click Insert Calculation > Submissions / Prescreens.
- Clicking the corresponding column headers, follow the same two above steps for the below calculations:
- Client Submissions / Submissions
- Interviews / Client Submission
- Job Offers / Interviews
- It’s important to note that the order in which you highlight the columns matters since inputs the first column selected as the dividend and the second column as the divisor.
- Starts / Job Offers
- It’s important to note that the order in which you highlight the columns matters since inputs the first column selected as the dividend and the second column as the divisor.
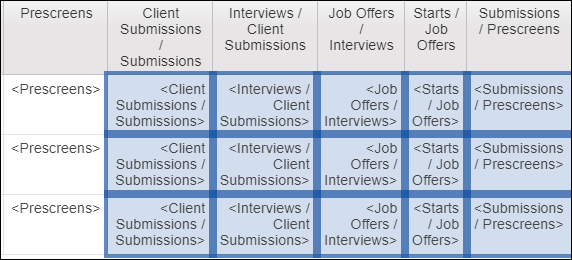
- Click one of the column headers you created, for example Submissions / Prescreens.
- Click and drag that column to put it next to one of the other calculation columns created above. For example, we are moving Submissions / Prescreens after Interviews / Client Submissions and before Submissions.
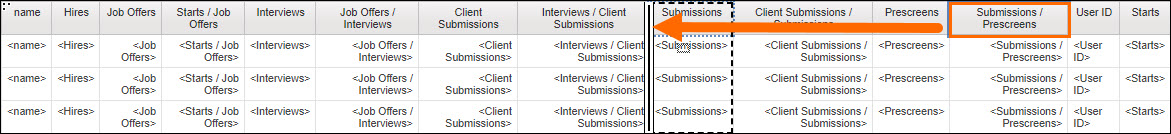
- Repeat this process until all of the above created calculation columns are grouped together.
- If you find the columns aren't responding to your clicks, it may be because the entire table still thinks it's selected. Make sure you click the column header first each time. When the table rows change from blue to white, you know you have the column selected correctly.
- If you find the columns aren't responding to your clicks, it may be because the entire table still thinks it's selected. Make sure you click the column header first each time. When the table rows change from blue to white, you know you have the column selected correctly.
- Holding down CTRL on your keyboard click the data rows for the division columns you created and grouped together.
- In the Show properties, under Data , click Data format > More.
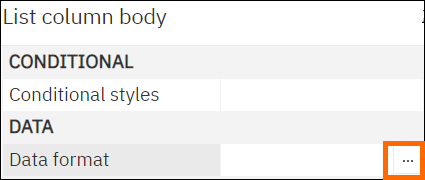
- In the Data format pop-up, click the Format type drop-down select Percent.
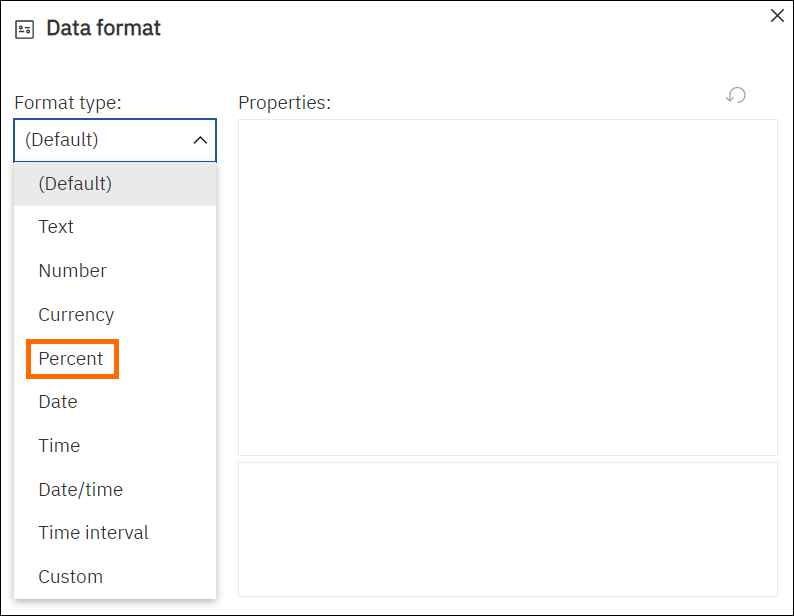
- Under Properties, click Number of Decimal Places, then from the drop-down, select 0.
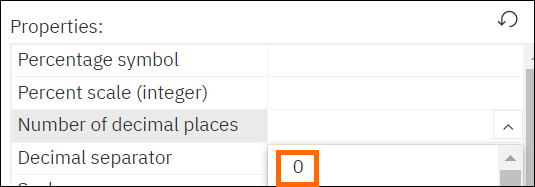
- Click OK.
- The below calculations are similar in concept but require additional steps:
- Fill Rate = # Placements / # Jobs
- Hit Rate = # Placements / # Client Submissions
- Avg Time to Internal Submit = # days between Job added date and first submission to the job
- Avg Time to Client Submit = # days between Job added date and Client Submission date
- Avg time to Fill = # days between Job added date and first placements for the Job.
Creating the Calculations Without Columns
Performing calculations usually requires that columns are added into the report for the necessary data, but we don’t want to add these columns to this report since we don’t need to see this data. The below instructions will show you how to calculate them without having to add in the columns.
Steps
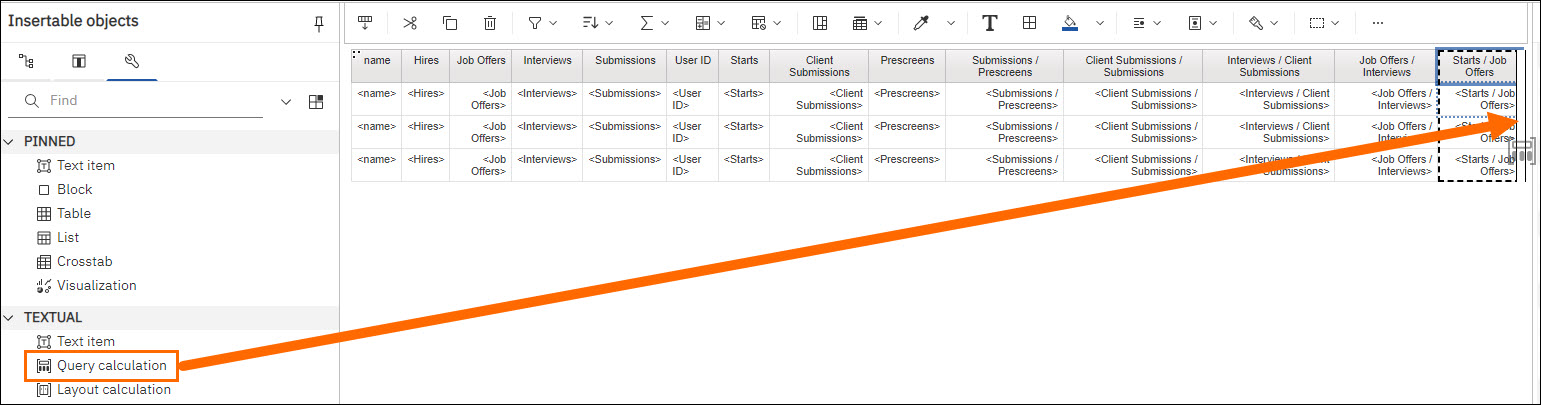
- Under Insertable Objects, click the Toolbox > Textual.
- Drag a Query Calculation to the end of your list.
- In the Data item expression - Data Item1 pop-up, under Available Components, click User Activity Analysis > Job Owned > Job Placement.
- Double-click Placement Count.
- In the Expression Definition box, place your cursor after [ROW COUNT] and type " / ".
- Be sure to include the leading and trailing spaces.
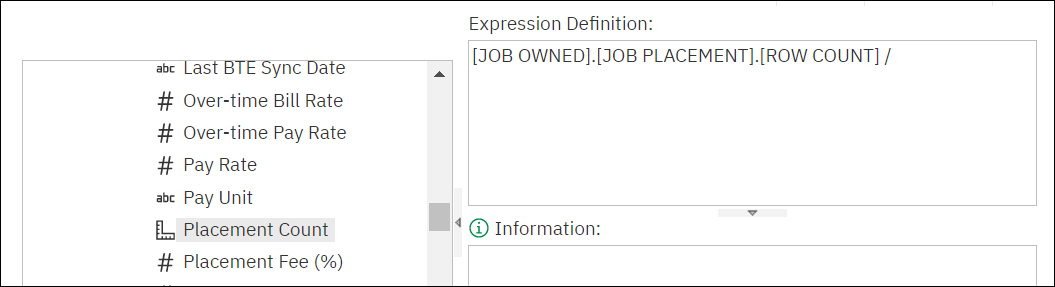
- Be sure to include the leading and trailing spaces.
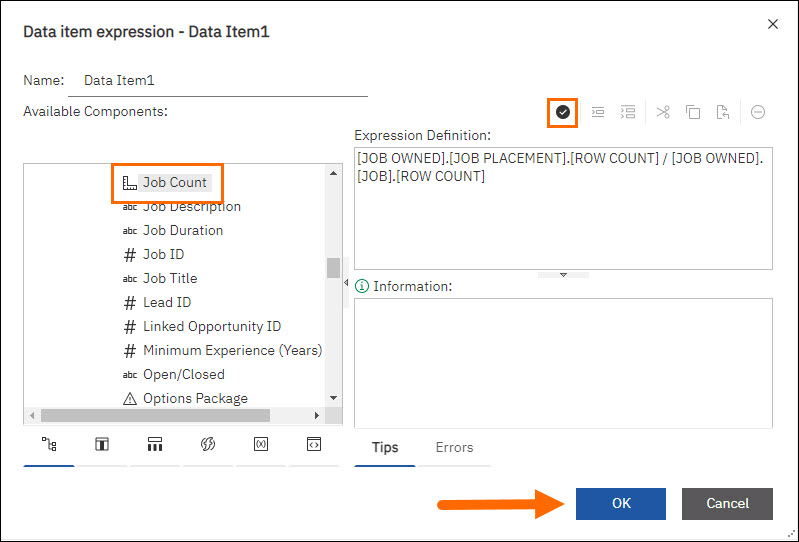
- With your cursor still here, look back under Available Components > User Activity Analysis > Job Owned, click Job.
- Double click Job Count.
- The expression should look like this:Copy
[JOB OWNED].[JOB PLACEMENT].[ROW COUNT] / [JOB OWNED].[JOB].[ROW COUNT] - Click Validate.
- Fix any errors that come up.
- Click OK.
- In the table, click the column header for Data Item1.
- In the Show properties, under Data Item in the Name field, enter "Fill Rate".
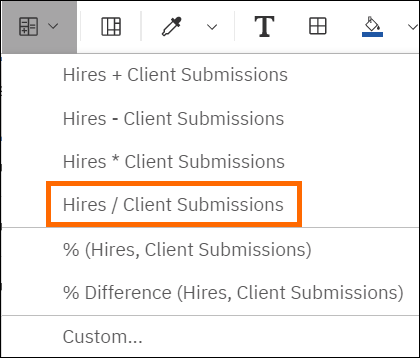
- Using CTRL on your keyboard, click the table's column headers for Hires and then Client Submissions.
- Click Insert Calculation > Hires / Client Submissions.
- Click and then drag the new Hires / Client Submissions column all the way to the end of the report.
- If you find the column isn't responding to your clicks, it may be because the entire table still thinks it's selected. Make sure you click the column header first. When the table rows change from blue to white, you know you have the column selected correctly.
- Click the column header for Hires / Client Submissions.
- In the Show properties, under Data Item in the Name field, enter "Hit Rate".
- Using CTRL on your keyboard, click the data rows Fill Rate and Hit Rate.
- In the Show properties, under Data, click Data format > More.
- In the Data format pop-up, click the Format type drop-down select Percent.
- Under Properties, click Number of Decimal Places, then from the drop-down, select 0.
- Click OK.
Calculating Averages
The remaining calculations are determining the average number of days between one date and another. To accomplish this we will use the _days_between function. It’s important to note that the _days_between function requires us to input the latest date first and the earliest date last.
If you put the data in any other order than the latest date first and the earliest date last, the output will be a negative number.
Steps
- Create another Query Calculation column as per Creating the Calculations Without Columns.
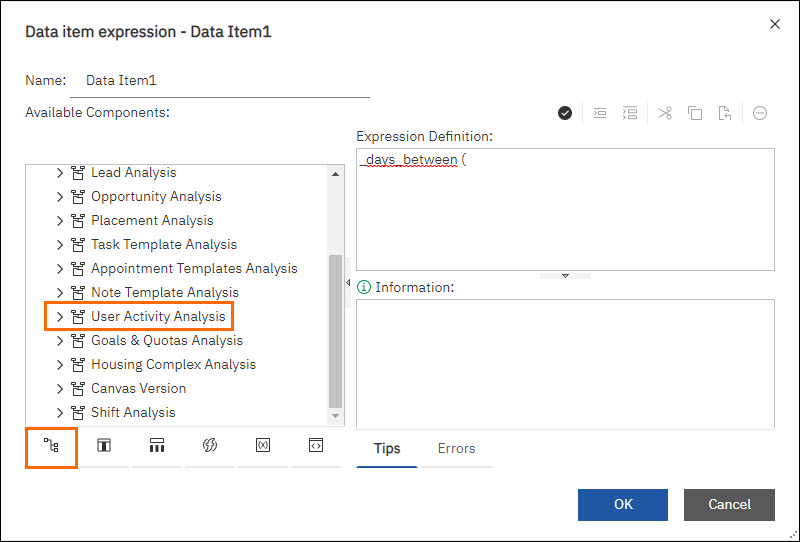
- In the Data item expression - Data Item1 pop-up, click the Functions tab.
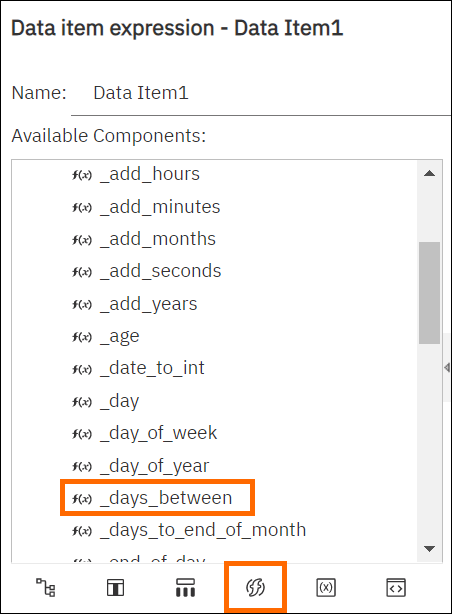
- Under Available Components, click the Business Date/Time Functions.
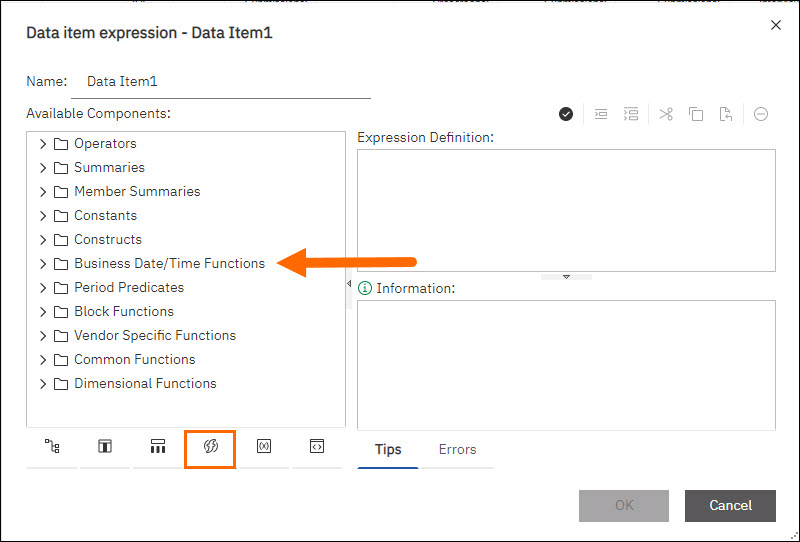
- Double-click f(x)_days_between.
- In the Expression Definition box, place your cursor at the end of the current expression.
- Still in the Data item expression - Data Item1 screen, click on the Source tab > User Activity Analysis > Submission Added > Submission.
- Double-click Date Added.
- In the Expression Definition box, place your cursor at the end of the current expression and type a ",".
- Still in the Data item expression - Data Item1 screen >Source tab > User Activity Analysis, click Job Owned > Job.
- Double-click Date Added.
- In the Expression Definition box, place your cursor at the end of the current expression and type a ")".
- The expression should look like this:Copy
_days_between ([SUBMISSIONS ADDED].[SUBMISSION ADDED].[dateAdded],[JOB OWNED].[JOB].[dateAdded]) - Click Validate.
- Fix any errors that come up.
- Click OK.
- In the table, click the data rows for Data Item1.
- In the Show properties, under Data, click Data format > More.
- In the Data format pop-up, click the Format type drop-down select Number.
- Under Properties, click Number of Decimal Places, then from the drop-down, select 0.
- This allows the result to show whole numbers.
- This allows the result to show whole numbers.
-
Click the Data Item1 column header.
-
In the Show properties, under Data Item in the Name field, enter "Avg Time to Submit (Days)".
-
Repeat all of the above steps for the remaining Calculations:
Creating the Prompts
We want to allow our users to select a date range and department for the report.
We are creating three prompts, one each for the start and end of the date range and one for department.
Steps
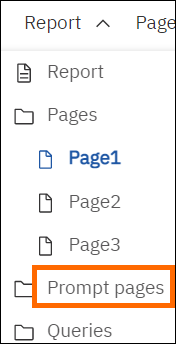
- Select the Report drop-down and select the Prompt Pages folder.
- From the Toolbox, double click Page.
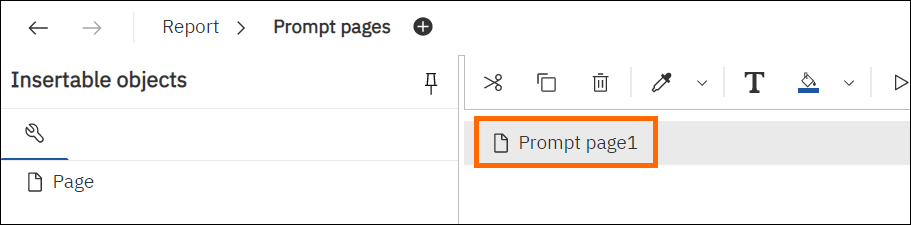
- Under the Prompt Pages section, double click Prompt Page1.
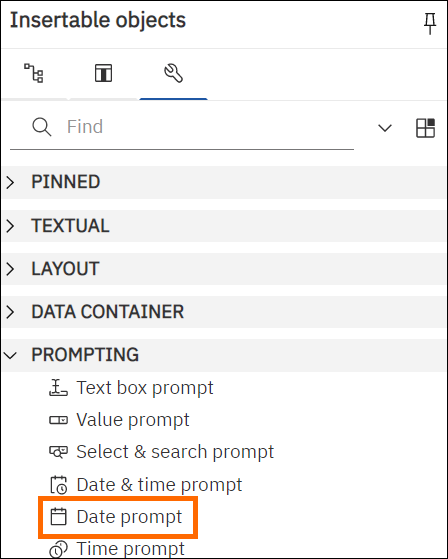
- Under Insertable Objects > Toolbox, click Prompting.
- Double-click Date Prompt.
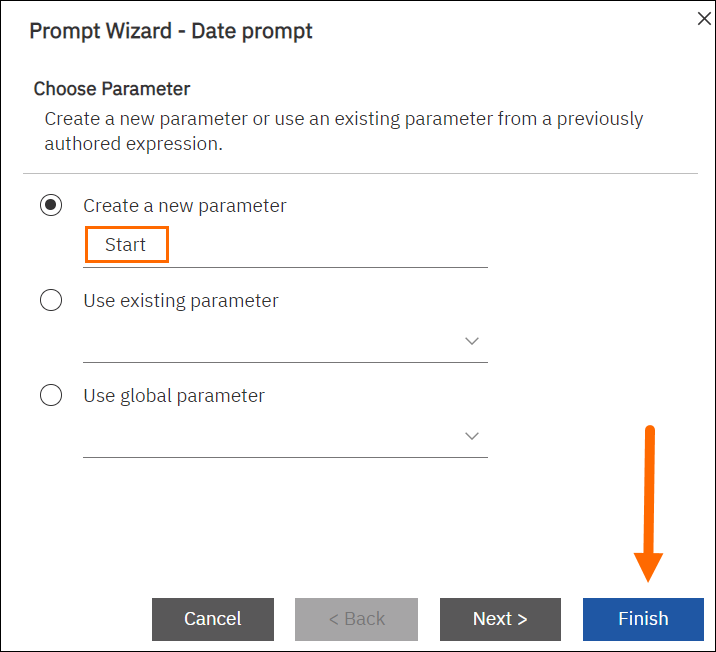
- In the Prompt Wizard - Date prompt, under Create a new parameter, type “start” and select Finish.
- Drag another Date Prompt to the right of the first one and in the Create a new parameter field type “end” and select Finish.
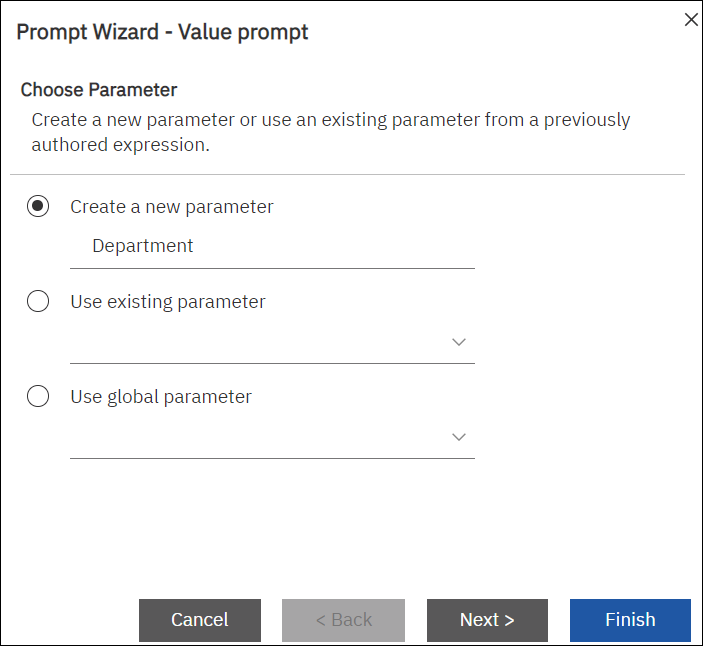
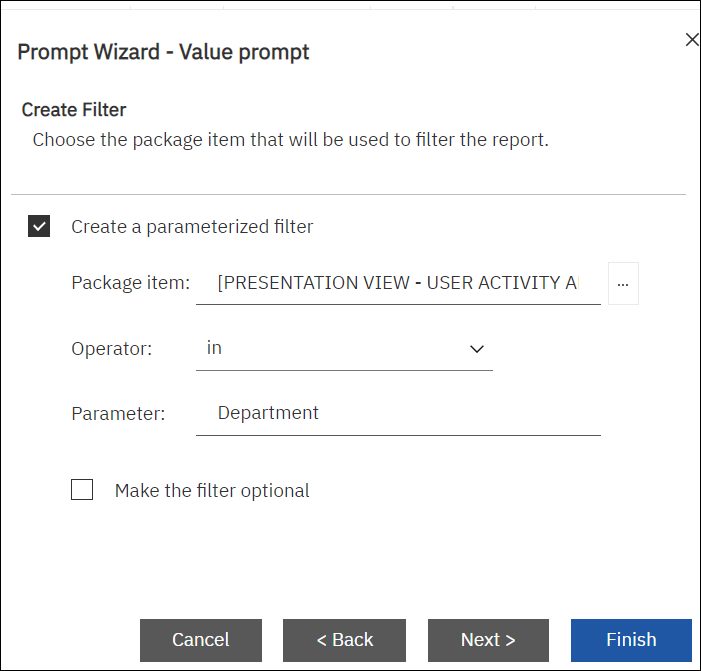
- Drag a Value Prompt to the right of the date prompt you just created.
- In the Create a new parameter field type in “Department” and click Next.
- Select the three dots to find the Package item.
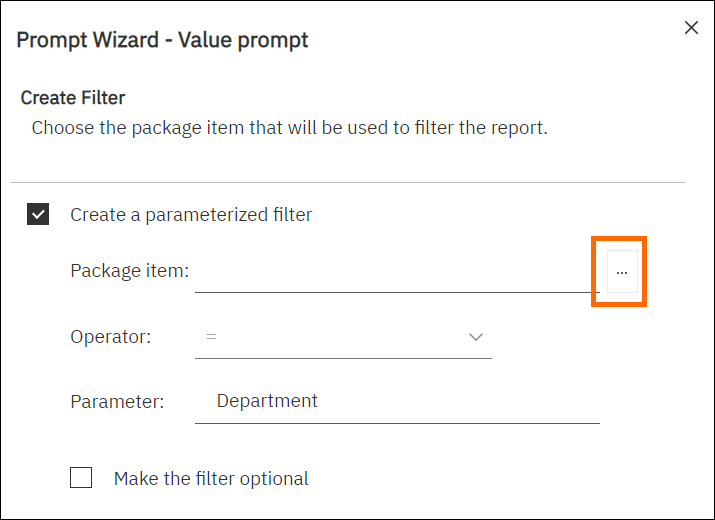
- In the Choose Package Item screen expand User Activity Analysis and then User and double-click Primary Department.
- Change the Operator to in and click Next.
- Click Finish.
Tying the Prompts to the Rows
We want to apply the date prompts to the dates we used in our calculations so that only relevant results show on our report.
Steps
- Select the Report drop-down and select Page 1.
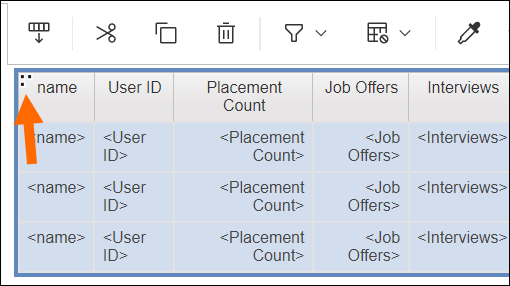
- Select entire table by using 3 dots on the upper left corner.
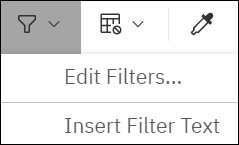
- From the Filter drop-down select Edit Filters....
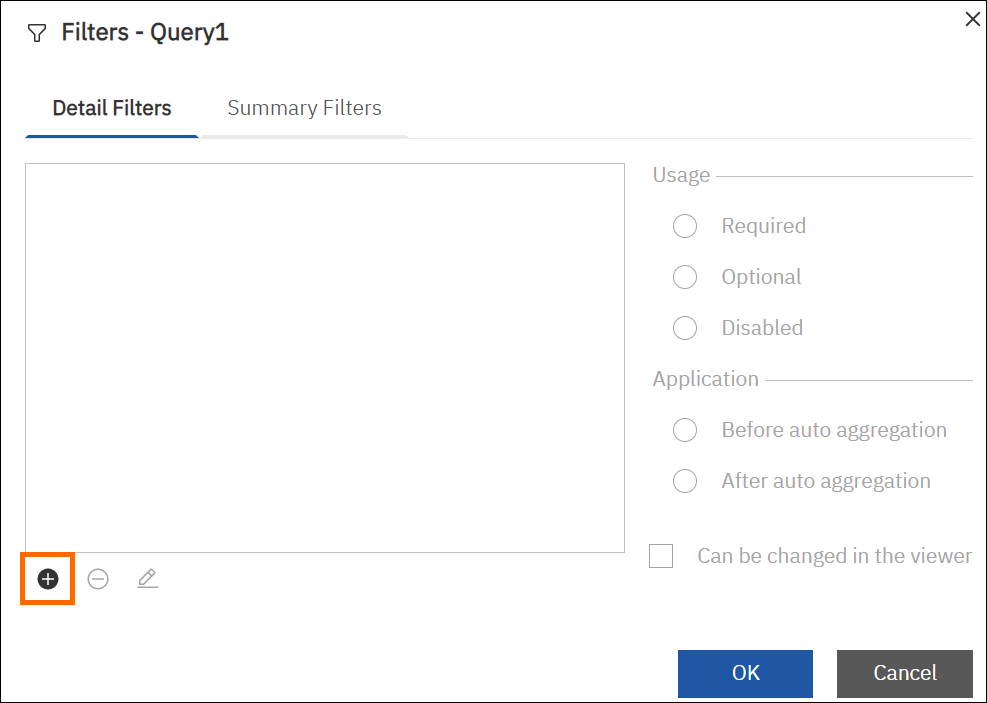
- Select the plus icon in the bottom left hand corner and choose Advanced then click OK.
- Under Available Components click User Activity Analysis > Note Template Added > Note Template.
- Double-click Date Added.
- Type “ between ?start? AND ?end?”.
- The expression should look like this:Copy
[Note ADDED].[Note].[dateAdded] between ?start? AND ?end?- Query Definition: This is telling Bullhorn Reporting to only pull notes added between the chosen date range. This will apply to all columns where we used a note type. A note type is defined as the note action selected when the note was entered into the system.
- Click Validate.
- Fix any errors that come up.
- Click OK twice.
- Create another advanced filter, using the same Advanced Filter steps above.
- Under Available Components click Client Submission Added > Submission.
- Double-click Date Sent.
- Type “ between ?start? AND ?end?”.
- The expression should look like this:Copy
[SENDOUT ADDED].[SENDOUT ADDED].[dateAdded] between ?start? AND ?end?- Query Definition: This is telling Bullhorn Reporting to only pull client submissions added between the chosen date range. This will apply to all columns where we used client submissions.
- Click Validate.
- Fix any errors that come up.
- Click OK twice.
- Create another advanced filter, using the same Advanced Filter steps above.
- Under Available Components click Interview Owned > Interview.
- Double-click Date Added.
- Type “ between ?start? AND ?end?”.
- The expression should look like this:Copy
[INTERVIEW OWNED].[INTERVIEW OWNED].[dateAdded] between ?start? AND ?end?- Query Definition: This is telling Bullhorn Reporting to only pull interviews added between the chosen date range. This will apply to all columns where we used interviews.
- Click Validate.
- Fix any errors that come up.
- Click OK twice.
- Double-click the Submissions data rows.
- Before the existing contents of Expression Definition type “CASE WHEN ” and press Enter on your keyboard.
- Place your cursor right after WHEN and expand Submission Added and then Submission and double click Date Added.
- Place your cursor after [dateAdded] and type “ between ?start? AND ?end? THEN ” and place your cursor at the end of the expression and type “ END”.
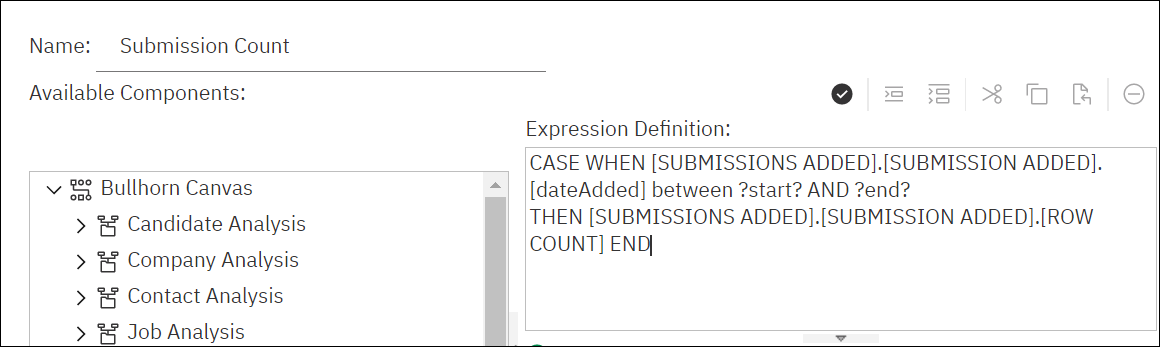
- The expression should look like this:Copy
CASE WHEN [SUBMISSIONS ADDED].[SUBMISSION ADDED].[dateAdded] between ?start? AND ?end?
THEN [SUBMISSIONS ADDED].[SUBMISSION ADDED].[ROW COUNT] END- Query Definition: This is telling Bullhorn Reporting to only pull submissions added between the chosen date range. This will apply to all columns where we used submissions.
- Click Validate.
- Fix any errors that come up.
- Click OK.
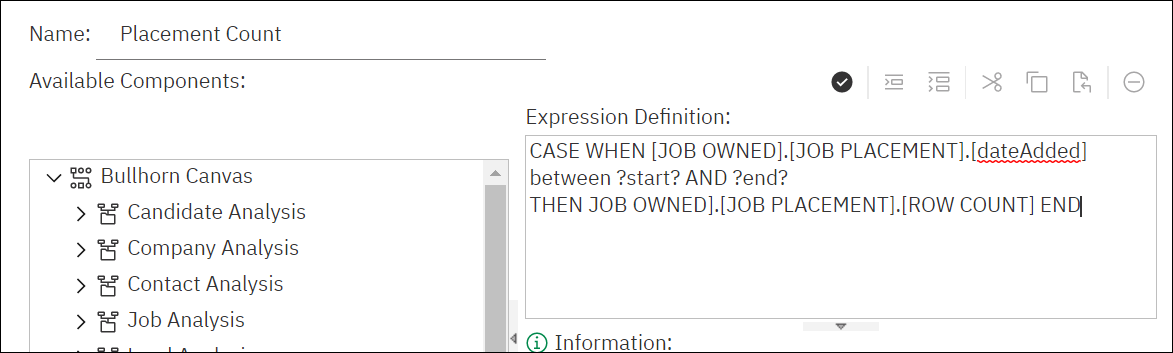
- Double-click the data rows for Hires.
- Type “CASE WHEN ” at beginning of the existing expression and press Enter on your keyboard.
- Make sure to include the space after WHEN.
- Place your cursor after WHEN.
- Under Available Components click Job Owned > Expand Job Placement.
- Double click Date Added.
- Type " between ?start? AND ?end? THEN ".
- Make sure to include the space after THEN.
- Make sure to include the space after THEN.
- The expression should look like this:Copy
CASE WHEN [JOB OWNED].[JOB PLACEMENT].[dateAdded] between ?start? AND ?end?
THEN JOB OWNED].[JOB PLACEMENT].[ROW COUNT] END- Query Definition: This is telling Bullhorn Reporting to only pull placements added between the chosen date range. This will apply to all columns where we used placements.
- Click Validate.
- Fix any errors that come up.
- Click OK.
- Double-click the data rows for Starts.
- Place your cursor after "Approved".
- Press Enter on your keyboard.
- Type "AND ".
- Under Available Components click Job Owned > Job Placement.
- Double click Start Date.
- Type " between ?start? AND ?end?".
- The expression should look like this:Copy
CASE WHEN [JOB OWNED].[JOB PLACEMENT].[status] = 'Approved'
AND [JOB OWNED].[JOB PLACEMENT].[dateBegin] between ?start? AND ?end?
THEN [JOB OWNED].[JOB PLACEMENT].[ROW COUNT] END- Query Definition: This is telling Bullhorn Reporting to only pull jobs added between the chosen date range. This will apply to all columns where we used placements.
- Click Validate.
- Fix any errors that come up.
- Click OK.
- Don’t forget to Save.
You have now finished your Recruiter Activity report!
For more information about advanced Bullhorn Reporting techniques you can search for “Cognos Workspace Advanced” on your desired search engine.
To learn the basics of writing an expression, see Building Expressions in Bullhorn Reporting (Previously Canvas) .