Creating a Recruiter Performance by Department Report
Creating a Recruiter Performance by Department Report shows the Fill Rate, Hit Rate, and various Average Times per Department. This article also covers calculating percentage averages, calculating days between Dates Added and Submission Dates, creating date prompts, and applying filters. 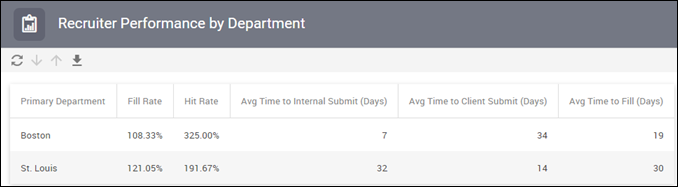
The following steps are included in this article:
- Building the Base of the Report and Adding Fields
- Calculating Fill Rate
- Calculating Hit Rate
- Calculating Average Times
- Cleaning Up the Report
- Applying Filters
- Adding Date Prompts
- Applying the Date Prompt Selections to the Report
Steps
Building the Base of the Report and Adding Fields
The Job Analysis package is the base of this report because the fields you are reporting on are stored in the job record.
Your chosen fields will be added from Source > Job Analysis. You can select additional fields beyond the ones outlined below to customize your own report.
You will add some fields to your report to perform calculations with but do not wish to see the actual fields on the report. As a result, you will add Internal Submit Date, Job Date, Client Submit Date and Placement Date Added and then remove the columns once you have your calculations.
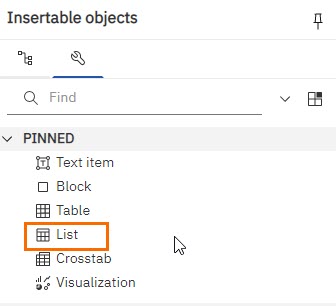
- From the Toolbox, add a List to the studio.
- From the Source tab, expand Job Analysis. From here, you will expand the following sub-sources and add the following fields to the report:
- Expand Job Owner and add Primary Department.
- Expand JobPlacement and add Placement Count.
- Expand Job and add Job Count.
Calculating Fill Rate
To calculate the Fill Rate divide the Number of Placements by the Number of Jobs.
- Hold down CTRL on your keyboard and select the headers for Placement Count and then Job Count.
- The order you click the headers is important because you want to divide Placement by Job and not Job by Placement.
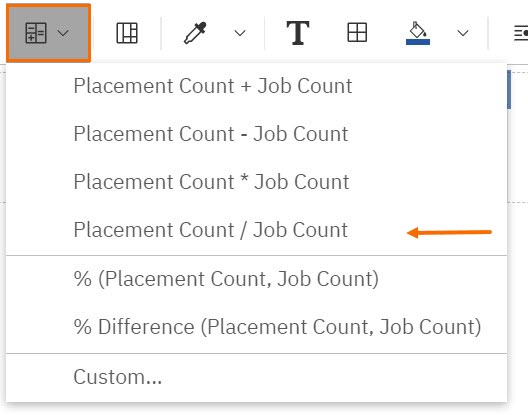
- Select the Insert Calculation drop-down from the Toolbar.
- Click Placement Count / Job Count.
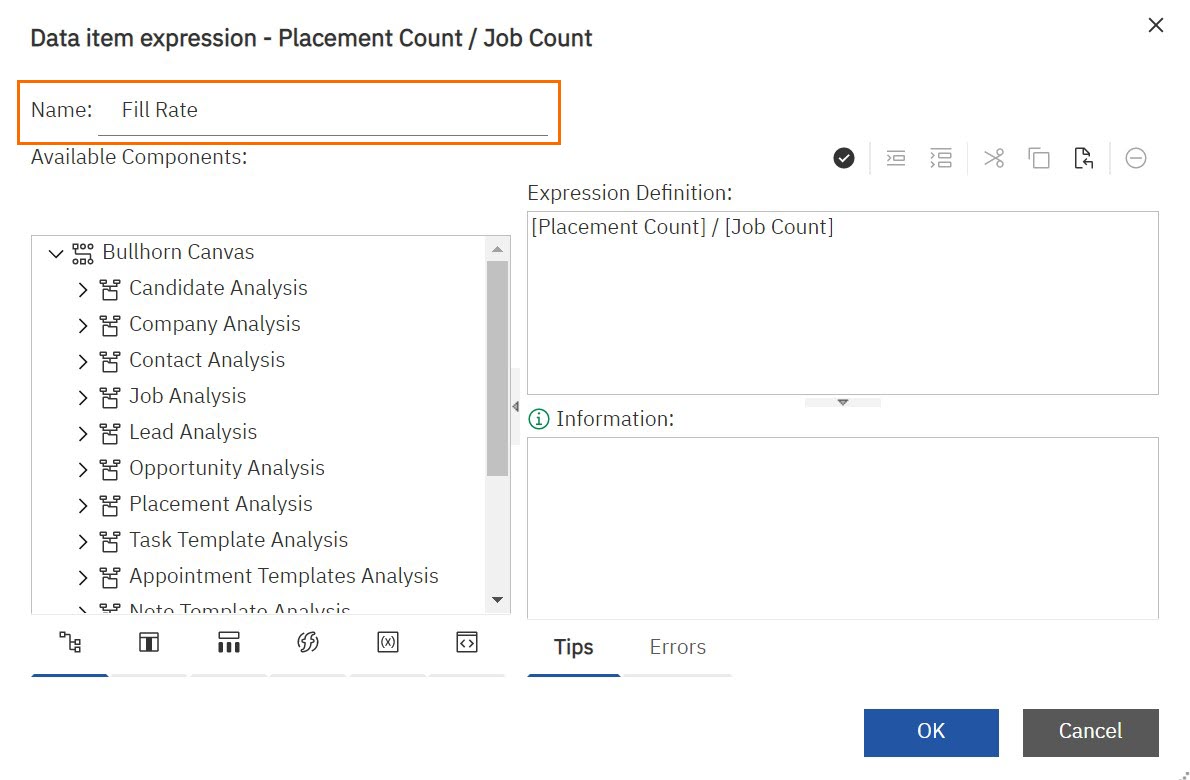
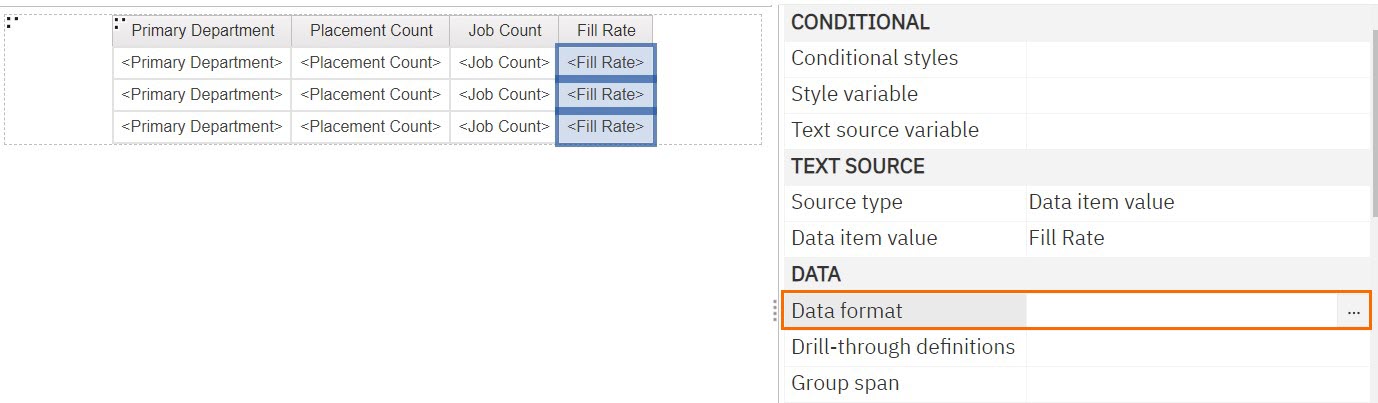
- Double-click the Placement Count / Job> Count header.
- In the popup, rename the field “Fill Rate” and click OK.
Restricting the Data
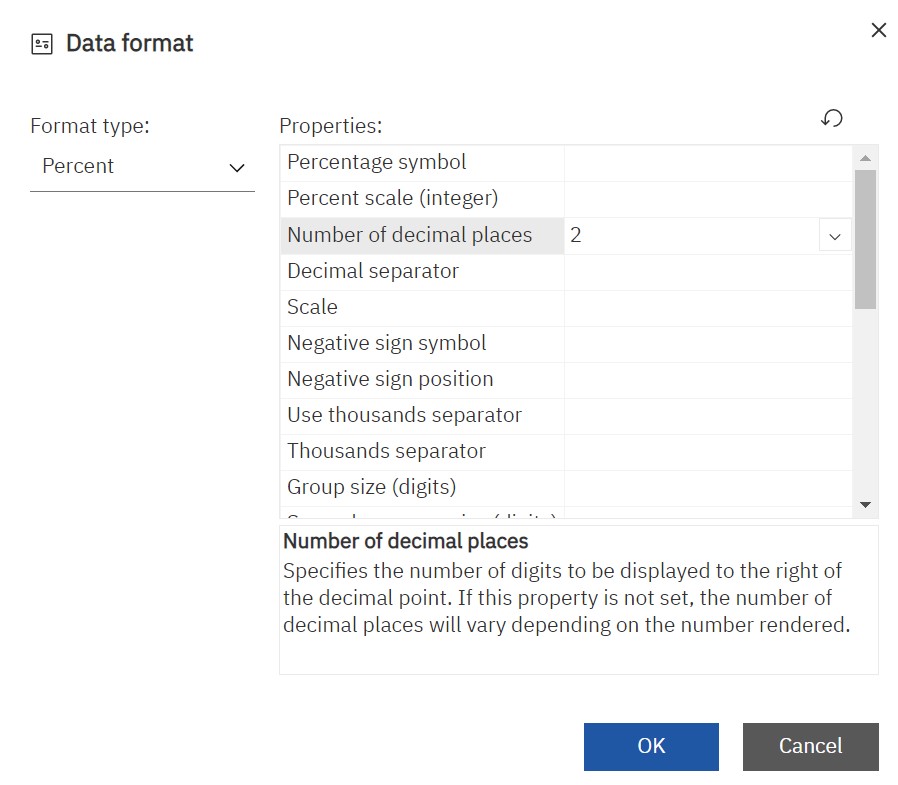
Use Data Format to restrict the data so the Fill Rate is a percent that uses only two decimal places.
- Select the rows under Fill Rate.
- In the panel on the right, select the three dots next to Data Format.
- From the Format Type drop down select Percent.
- In the Properties under No. of Decimal Places, select 2. Click OK.
Calculating Hit Rate
To calculate the Hit Rate divide the Number of Placements by the Number of Client Submissions.
- On the Source tab, from Job Client Submission add Client Submission Count to the list report.
- Hold down CTRL on your keyboard and select Placement Count and then Client Submission Count.
- Select the Insert Calculation drop-down from the Toolbar.
- Choose Placement Count / Client Submission Count.
- Double-click the Placement Count / Client Submission Count header.
- In the popup, rename the field “Hit Rate” and click OK.
Restricting the Data
Use Data Format to restrict the data so the Hit Rate is a percent that uses only two decimal places.
- Select the rows under Hit Rate.
- In the panel on the right, select the three dots next to Data Format.
- From the Format Type drop-down select Percent.
- In the Properties under No. of Decimal Places, select 2. Click OK.
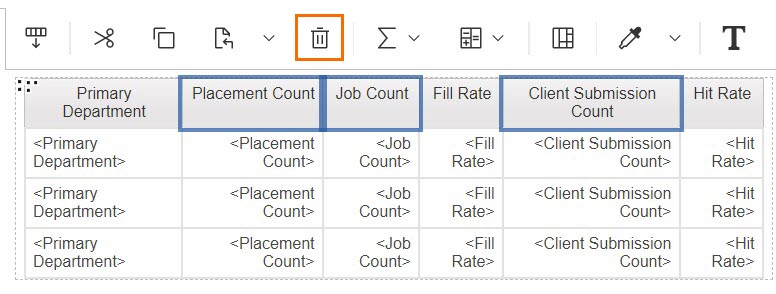
- Hold CTRL and select Placement Count, Job Count, and Client Submission Count column headers and click the Delete icon.
Check your Progress now. Save and run your report. Your report should look similar to the image below.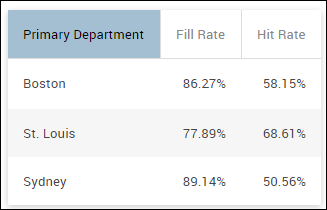
Calculating Average Times
You will create three calculations: Average Time to Internal Submit, Average Time to Client Submit, and Average Time to Fill.
Average Time to Internal Submission
To calculate Average Time to Internal Submission compute the number of days between the Job Added date and the First Submission to the Job.
You will rename the Date Added fields so it will be clear which date is for which type of submission.
- In the Source tab, expand Job Analysis > Job and add Date Added.
- Double-click the Date Added header and change the Name to “Job Date”. Click OK.
- Back in the Source tab, expand JobSubmission and add Date Added.
- Double-click the Date Added header and change the Name to “Internal Submit Date”. Click OK.
- Hold down CTRL and select Internal Submit Date and then Job Date.
- The functions in take the later date first and the earlier date second. If you don’t select your dates in the correct order, you’ll end up with a negative number.
- Select the Insert Calculation drop-down from the Toolbar.
- Choose Days between.
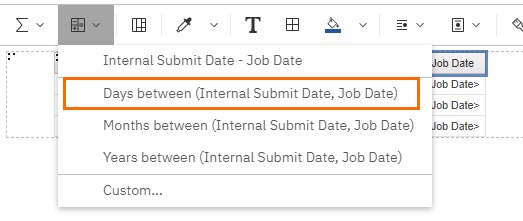
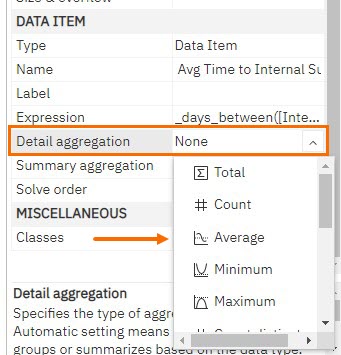
- Double-click the Days Between header and change the Name to “Avg Time to Internal Submit (Days)”. Click OK.
- In the Propertiespanel, under Data Item select the Detail aggregation drop-down and choose Average.
- The aggregate function controls how the column calculates the formula you selected. In our example, we want to calculate an average.
- The aggregate function controls how the column calculates the formula you selected. In our example, we want to calculate an average.
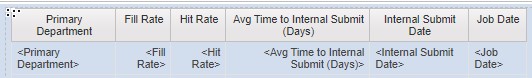
- Move this new column next to Hit Rate by dragging it over, so your report looks like this:
Average Time to Client Submission
To calculate Average Time to Client Submission compute the number of days between the Client Submission date and the Job Added date.
- Under the Source tab, expand Job Analysis > Job Client Submission and add Date Sent.
- Double-click the Date Sent header and change the Name to “Client Submit Date”. Click OK.
- Hold down CTRL and select Client Submit Date and Job Date, in that order.
- Select the Insert Calculation drop-down from the Toolbar.
- Choose Days between.
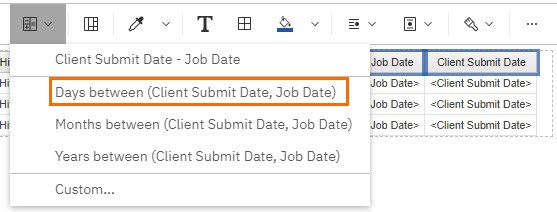
- Double-click the Days Between header and change the Name to “Avg Time to Client Submit (Days)”. Click OK.
- Click the Avg Time to Client Submit data rows.
- In the Propertiespanel, under Data Item select the Detail aggregation drop-down and choose Average.
Average Time to Fill
Calculate the average time it takes a fill a job by computing the days between the Placement Added date and the Job Added date.
- On the Source tab, expand Job Analysis > Job Placement and add Date Added.
- Double-click the Date Sent header and change the Name to “Placement Date Added”. Click OK.
- Hold down CTRL and select Placement Date Added and then Job Date.
- Select the Insert Calculation drop-down from the Toolbar.
- Choose Days between.
- Double-click the Days Between header and change the Name to “Avg Time to Fill (Days)”. Click OK.
- Click the Avg Time to Client Submit data rows.
- In the Properties panel, under Data Item select the Detail aggregation drop-down and choose Average.
Cleaning Up the Report
Now cleanup and format the report by removing the columns used only for calculations and formatting the other columns. These steps walk you through formatting the report to see the correct data when it is ran.
- Hold down CTRL and select Internal Submit Date, Job Date, Client Submit Date and Placement Date Added then press Delete on your keyboard.
- The average times need to be in whole days. Press and hold CTRL and select the data rows for all 3 Avg Time columns.
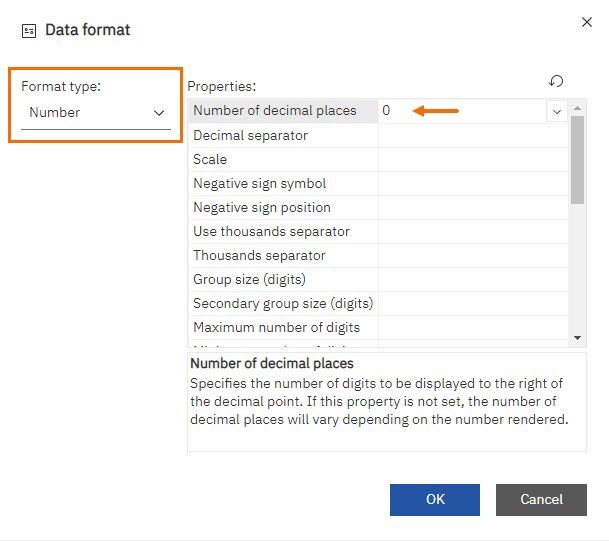
- In the panel on the right, click Data format under the Data section.
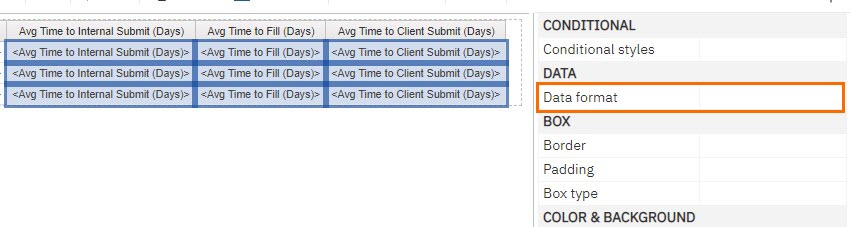
- Under Format Type select Number.
- Under No. of Decimal Places, select 0 and click OK.
Check your Progress now. Save and run your report. Your report should look similar to the image below.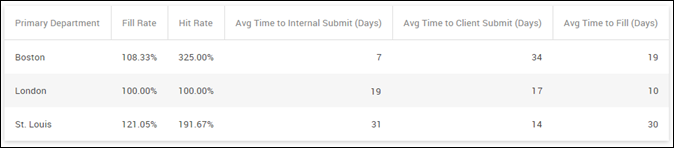
Applying Filters
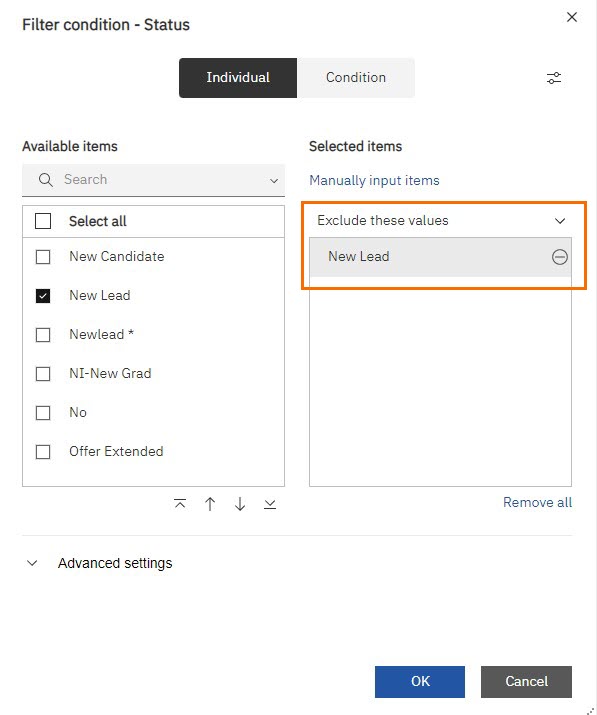
By default, all submissions will be included in your report. You don’t want to include web responses as that would inflate your reported numbers artificially. In your database, Candidates and Submissions are identified with a status of New Lead as web responses. Exclude these from your results by applying Status Filters.
- Under the Source tab, expand Job Analysis > Job Client Submission Related Records > Client Submission Candidate.
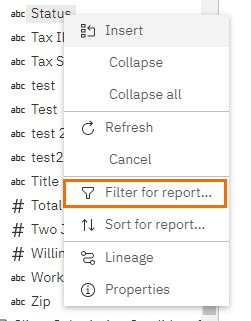
- Right click on Status and select Filter for report...
- Add New Lead under Exclude these values.
- Click Ok to save.
- Repeat this for the Job Submission Candidate and Job Placement Candidate statuses:
- Expand Job Analysis > Job Submission Related Records > Submission Candidate. Right click Status > Filter for report. Add New Lead under Exclude these values.
- Expand Job Analysis > Job Placement Related Records > Placement Candidate. Right click Status > Filter for report. Add New Lead under Exclude these values.
Adding Date Prompts
Create two prompts, one for the start date and one for the end date, so users can select a date range.
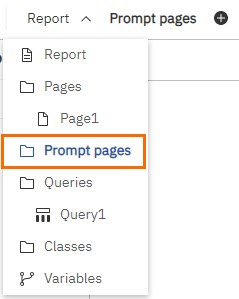
- Click Report > Prompt Pages.
- Add a Prompt Page by clicking the Add icon.
- Open the prompt page to edit by double-clicking Prompt Page 1.
- Under Toolbox, double-click Date Prompt.
- Under Create a new parameter type in “Start”.
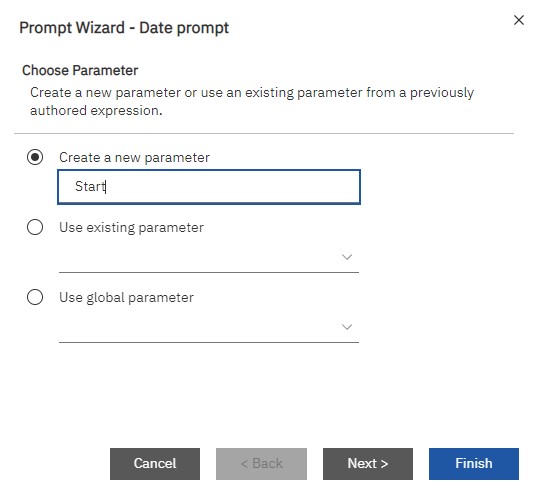
- Select Finish.
- Drag another Date Prompt to the right of the previous one. Name this one “End” and select Finish.
Updating the Pompt User Interface
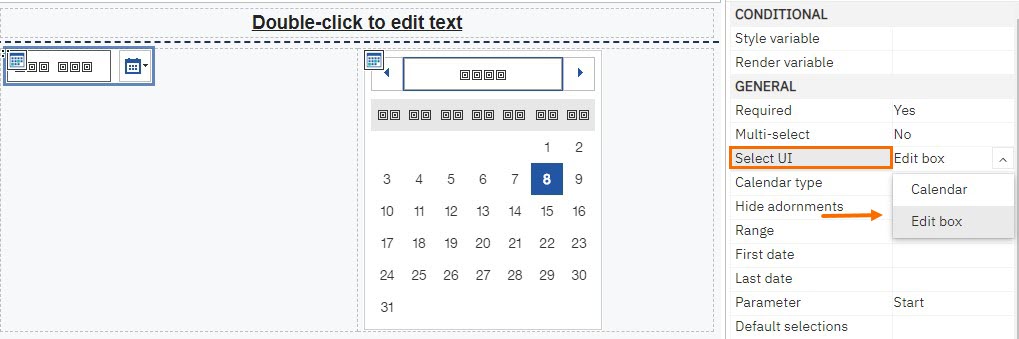
The Date Prompts automatically add as calendars. You need to change these to drop-downs so they don't take up the whole screen.
- Select the first date prompt.
- In the Properties Panel, under General select the Select UI drop-down.
- Choose Edit Box.
- Repeat for the second date prompt.
Applying the Date Prompt Selections to the Report
Ensure the date range selected via the prompt will change the results of your report by following the steps below. This process needs to be completed for each date field that is impacted. This includes the following fields:
- Job Date Added
- Job Placement Date Added
- Job Client Submission Date Sent
- Job Submission Date Added
- Navigate back to Page 1.
- Select the whole list by clicking on the 3 dots in the upper left corner of the list.
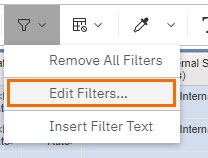
- Select the Filter icon from the Toolbar and choose Edit Filters.
- Select the Add icon in the bottom left corner of the pop up.
- Choose Advanced > OK.
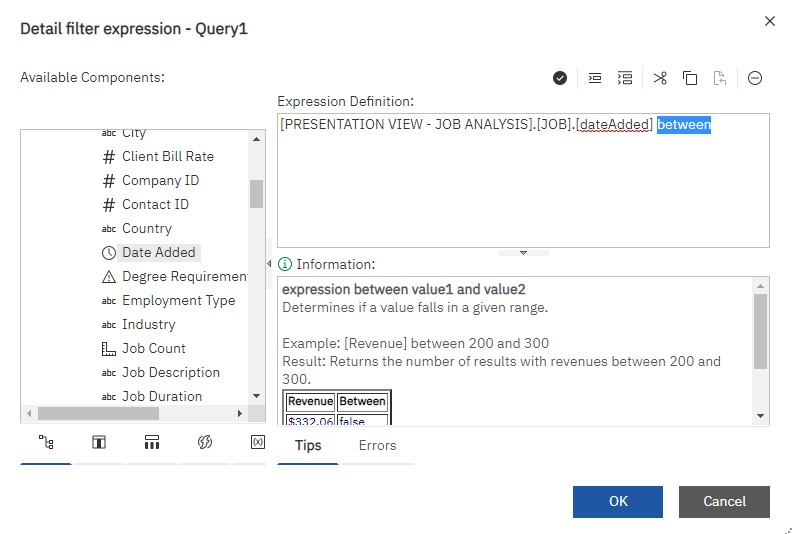
- Under Available Components expand Job Analysis > Job.
- Double-click Date Added, then place your cursor at the end of the expression and type " between ".
- Ensure you include spaces on either side of between otherwise the expression will not validate.
- Between is a function that calculates the number difference between the first and second parameters.
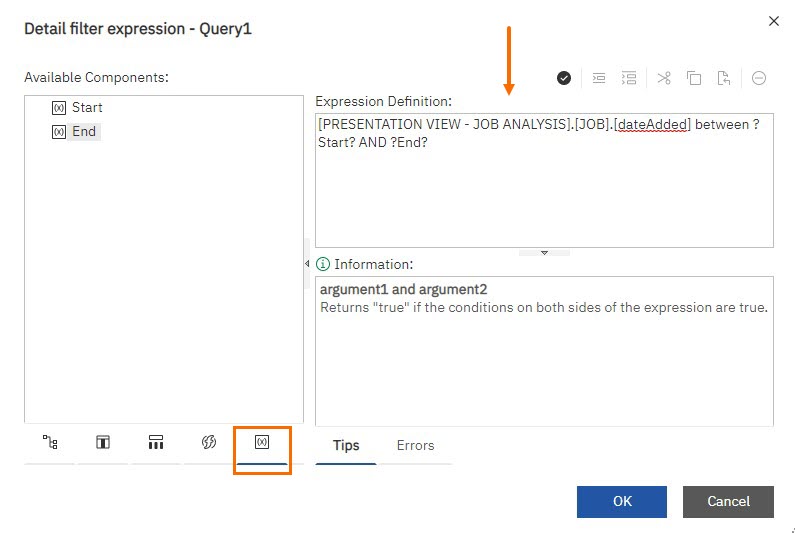
- Select the Parameters icon to access the report parameters.
- Double-click Start, place your cursor after that and type “ AND ” then double-click End.
- Ensure you include the spaces so that your expression otherwise the expression will not validate.
- Ensure you include the spaces so that your expression otherwise the expression will not validate.
- Select OK to save the expression.
If you run across an error at this point, read through the error to determine where your mistake is and make any corrections. See Untangling Validation Errors for more information.
Repeating the Process for the Remaining Fields
Repeat this process for the remaining dates used in your prior calculations.
- Select the Add icon > Advanced > OK.
- Under Available Components expand Job Analysis > Job Placement and double-click Date Added.
- Place your cursor after [dateAdded] and type “ between ?Start? AND ?End?” and select OK.Copy
Final Expression
[PRESENTATION VIEW - JOB ANALYSIS].[JOB PLACEMENT].[dateAdded] between ?Start? AND ?End? - Select the Add icon > Advanced > OK.
- Under Available Components expand Job Analysis > Job Client Submission and double-click Date Sent.
- Place your cursor after [dateAdded] and type “ between ?Start? AND ?End?” and select OK.Copy
Final Expression
[PRESENTATION VIEW - JOB ANALYSIS].[JOB SENDOUT].[dateAdded] between ?Start? AND ?End? - Select the Add icon > Advanced > OK.
- Under Available Components expand Job Analysis > JobSubmission and double-click Date Added.
- Place your cursor after [dateAdded] and type “ between ?Start? AND ?End?” and select OK.Copy
Final Expression
[PRESENTATION VIEW - JOB ANALYSIS].[JOB SUBMISSION].[dateAdded] between ?Start? AND ?End? - Select OK again to close the filter window.
- Save and run your report.
You have now successfully finished your Recruiter Performance report.
Related Articles
For more information about advanced Bullhorn Reporting techniques you can search for “Cognos Workspace Advanced” on your desired search engine.