| Edition: Enterprise | Audience: All Users |
Example Trend: Metric Correlation
Trends can be used to identify relationships between metrics, plot two that might be related and examine how they interact over time - is one driving the other?
What this Trend Does
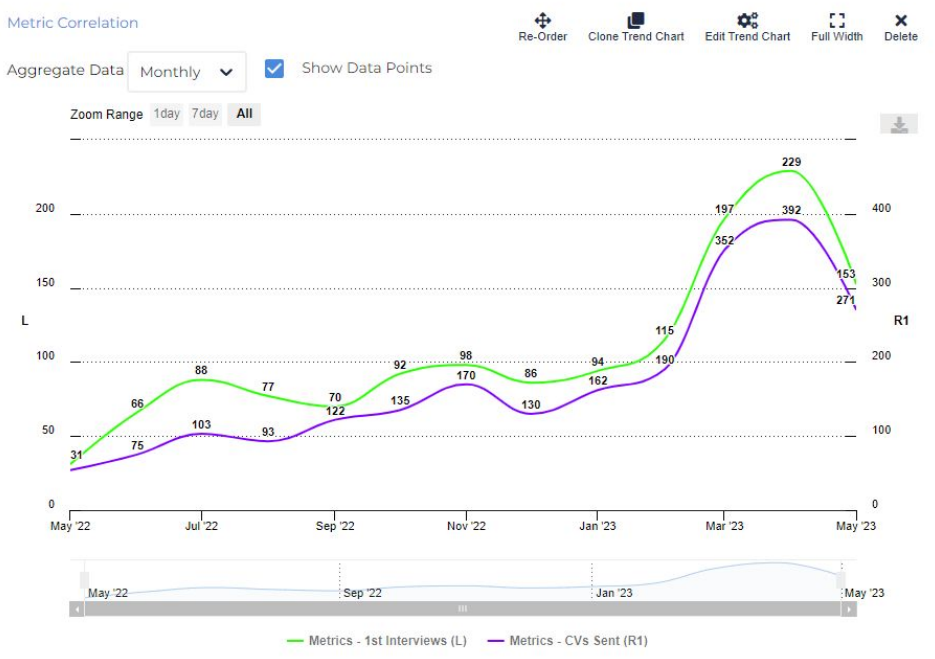
This trend simply measures CVs Sent and 1st Interviews. By following the two lines, it’s clear that months with higher activity in one tend to result in higher activity in the other.
In many cases, correlation does not equal causation, so it's important when using this feature to not draw any untested conclusions. However it is logical that the more introductions are made between candidates and clients in a month, the more opportunities there are for interviews to be booked.
Features Used
- Dual Axis: This trend makes use of the Left/Right Y-Axis. The left goes up to 250 whilst the right goes to 500 because many more CVs are sent than interviews, but using a dual axis aligns the plot more closely and makes it easier to identify possible trends or correlation.
- Show Data Points: This trend is set up to show data points on the chart. This is particularly helpful when using two axes to immediately understand the data. Clarity on this data suggests that it can take between 1.1 and 1.7 submissions to book an interview.
Was this helpful?