| Edition: Enterprise | Audience: All Users |
Example Trend: Seasonality
Data groups are particularly useful when identifying seasonality. Try running a metric Period on Period across multiple timeframes and find out whether there are particularly good months or quarters for certain activities, such as Jobs Added.
What this Trend Does
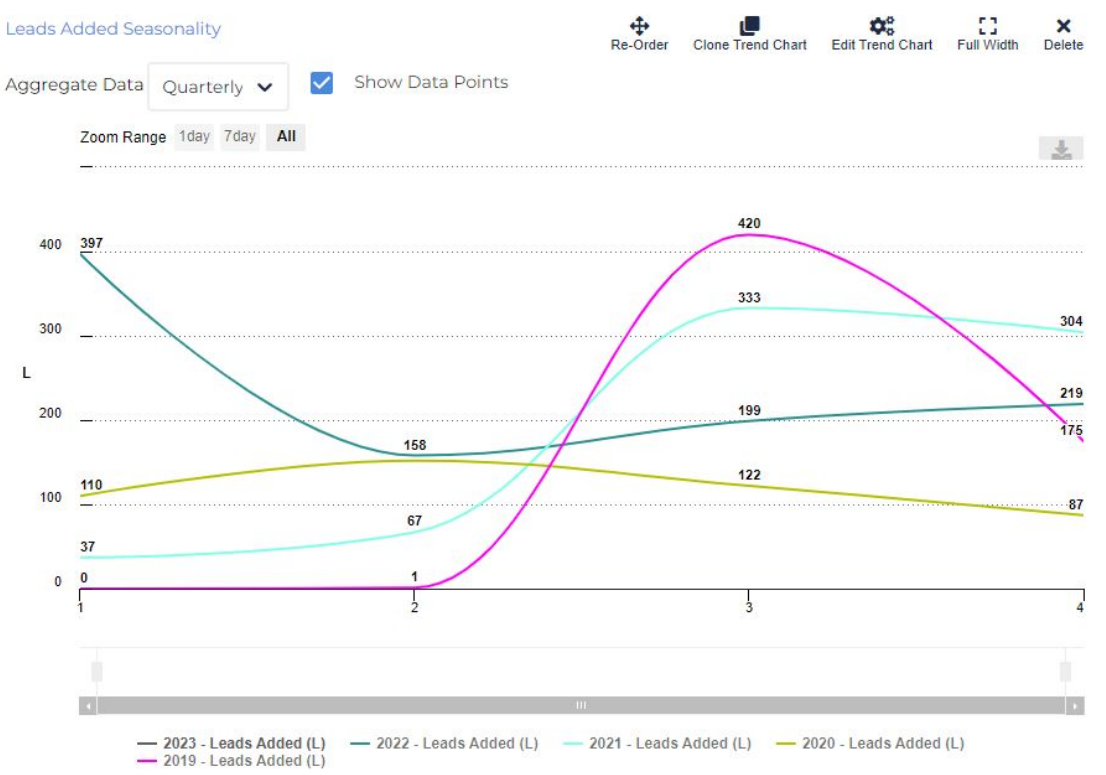
This trend counts the number of Leads added across the company over years 2019-2023. A quick glance suggests that it’s common for the number of leads added to jump between Q2 and Q3 (4 out of 5 years).
The information provided could reveal insights about the market, such as potential hiring increases in Q3 or more active candidate searches during the summer. It also suggests that targets could be adjusted to account for seasonal trends, or that specific metrics could receive more emphasis at certain times of the year. For example, how do client meetings tend to fluctuate throughout the year?
Features Used
- Data Groups: Data Groups are central to the entire trend. These were created easily by perfecting an initial group and then duplicating the first group multiple times. To finalise the trend, all that was required was a change to each timeframe.
- Period On Period: Rather than plot each year sequentially, enabling Period on Period showed each year’s quarters overlaid on top of each other; so you can easily spot any periods of seasonality