Generating a Sales Activity Report
You can run the Sales Activity Report to track sales activity for yourself, other users, and your team.
Running the Report
-
From the Menu, select Tools > Reporting.
-
Select the Standard Reports drop-down list.
-
Next to the Sales Activity Report, select Run.
-
Limit the records returned in this report by setting one or more of the filters in the list below.
-
Reporting Period: Time period of the activity to include. If blank, defaults to last week.
-
Start and End Date: Date range of the activity to include. If selected, the report pulls for these dates and ignores the Reporting Period drop-down.
-
Filter user activity by: Limits data to activity you own.
-
Salesperson: Limits data to activity for the selected users for which they are the job or activity owner. If selected, the report pulls for these individuals and ignores the Me check box.
-
Company: Limits activity to the selected companies.
-
Filter department activity by: Limits data to activity for your primary department.
-
Department: Limits data to activity for selected users for whom the selected department is the primary department. If selected, the report pulls for recruiters in these departments and ignores the My Department check box.
-
If you select specific departments, the report pulls for those departments and ignores the My Department check box.
-
Graph: Select this checkbox to hide the graphical version of the report when generated.
-
Export Level: Level of detail you want to export. Select Summary to not include low-level details or select Detail to include low-level details. This filter only applies when the report format is Unformatted Excel.
-
Report Format: Display format of the report: web page or unformatted Excel.
-
-
At the bottom of the page, select Generate Report.
Report Columns
Refer to the following image and table to understand the columns that appear on the report.
This report only displays 150 records. Activity totals display by department, then for individual sales people.
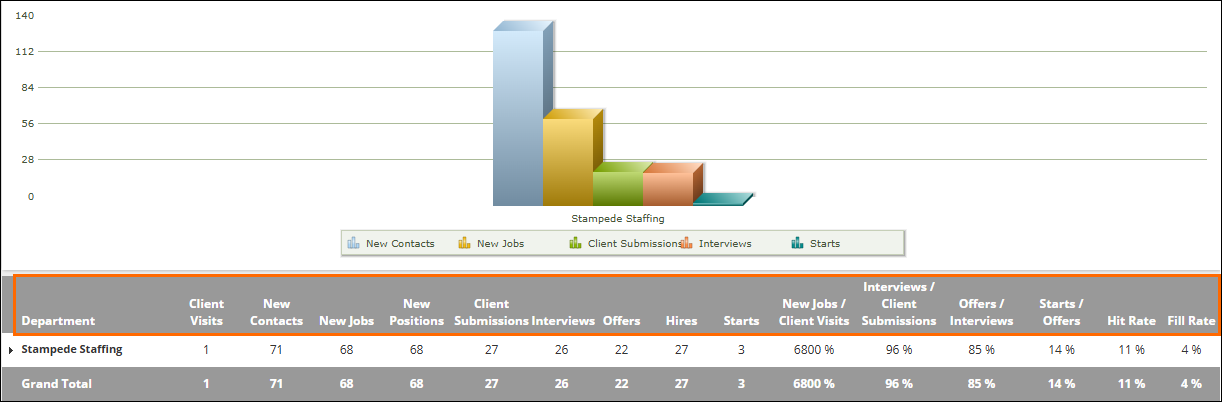
|
Column |
Description |
|---|---|
| Department |
Organizes activity by the departments in your organization. |
| Company Visits |
Number of notes added to Contact records in the selected date range with a note type of Client Visit. |
| New Contacts |
Number of new contacts the user owns that were added in the selected date range. |
| New Jobs |
Number of new jobs the user owns that were added in the selected date range. |
| New Positions |
Number of positions for new jobs the user owns that were added in the selected date range. |
| Client Submissions |
Number of client submissions that were added in the selected date range. The job owner gets credit regardless of who made the client submission. |
| Interviews |
Number of appointments where the:
|
| Offers |
Number of submissions where the status was Offer Extended within the selected date range. |
| Hires |
Number of placements submitted against jobs the user owns that were added within the selected date range. |
| Starts |
Number of placements where the:
|
| New Jobs / Company Visits |
Ratio of new jobs to client visits. |
| Interviews / Client Submissions |
Ratio of interviews to client submissions. |
| Offers/Interviews |
Ratio of offers to interviews. |
| Starts/Offers |
Ratio of starts to offers. |
| Hit Rate |
Ratio of starts to client submissions. |
| Fill Rate |
Ratio of starts to new positions. |