Running the Executive Dashboard
The Executive Dashboard offers a high-level summary of your recruiting and sales activity. The dashboard is comprised of six reports:
- Starts (YTD)
- Ends (YTD)
- Headcount
- Financials
- Activity (YTD)
- Success Ratios
This article describes each report, details the insights provided and any values that will be required for the report to run. Report names may differ depending on your company's terminology.
Starts (YTD)

Starts report details the number of placements starting year to date as well as the number of placements starting this month.
The report provides number of contract and permanent placements with a current or prior status of "Approved", a start date between January 1 of the current year and today. Month to date data provides the number of contract and permanent placements with a current or prior status of "Approved", with a start date between the first day of the current month and today. The Starts report requires the following fields be populated:
- For contract placements, the bill rate and pay rate fields have a value greater than "zero" and the end date must contain a value.
- For permanent placements, both the salary and fee % must have values greater than "zero".
Ends (YTD)

Ends report details the number of placements ending year to date as well as number of placements ending this month.
The report provides the number of contract and permanent placements with a status of "Completed" or "Terminated". Data includes placements with end dates between January 1 of the current year and today. Month to date data provides number of contract and permanent placements with a status of "Completed" or "Terminated". Data includes placements with end date between the first day of the current month and today.
Headcount
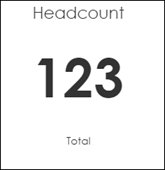
Headcount report details number of currently active, approved contract/temp placements.
The report provides number of contract/temp placements with:
- A status of "Approved".
- A bill rate and pay rate greater than zero
- A correctly formatted end date.
Financials
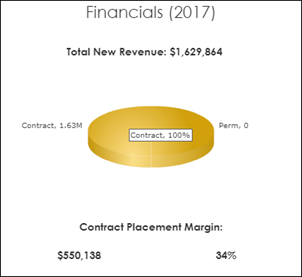
Financials report details permanent and contract placement revenue.
Total New Revenue
Estimated revenue for this year for placements with a current or prior status of "Approved" and the "Date Added" is between January 1 of this year and today.
Bullhorn determines if a placement is contract or permanent using the following logic:
- Contract placements must have a bill rate and pay rate greater than "zero" and contain an end date.
- Contract revenue is calculated for all qualifying contract placements using this formula:
- start date - end date = days worked (only counts Monday through Friday)
- bill rate x days worked = estimated revenue
|
If Pay Unit is... |
then Days Worked is... |
|---|---|
| Hour |
Days Worked x 8 |
| Day |
Days Worked |
| Week |
Days Worked / 5 |
| Month |
Days Worked / 21 |
If the Pay Unit does not match any of the above, Bullhorn defaults to "Hour".
- Permanent placements are placements with a salary and fee % greater than zero.
- Permanent revenue is calculated across all qualifying placements using this formula: flat fee (salary x fee %) = revenue
Contract Placement Margin
Margin for contract placements with a start date "between January 1 and today" and margin as a percent of contract revenue.
- Margin is calculated using this formula: Total Margin Qualifying Placements / Total Revenue = Margin
- Margin amount for a placement is calculated using this formula: Placement Revenue x Placement Reported Margin = Margin for a Placement
Activity (YTD)
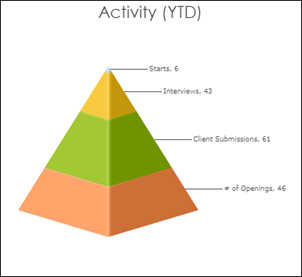
The activity report provides the number of job openings, client submissions, interviews and placements added this year. The report details the number of job openings, client submissions, interviews, and placements added this year that meet the following:
- A current or prior status of "Approved".
- A start date "between January 1 of the current year and today".
Hovering your cursor over each section of the pyramid displays a percentage. This percentage is calculated by dividing the number displayed for that section by the total number of activities (in this example: 21/48 = .4375).
Success Ratios
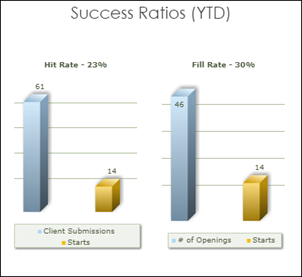
The Success Ratios report details hit rate (number of client submissions resulting in placement starts) and fill rate (number of job openings that result in a placement start) for jobs.
Hit Rate
Hit rate is the percentage of client submissions that result in placements. Placements must have a current or prior status of "Approved" and a start date "between January 1 of the current year and today".
The graph displays the number of client submissions and placement starts.
Fill Rate
Fill rate is the percentage of job openings that result in placements. Placements must have a current or prior status of Approved and a start date between January 1 of the current year and today.
The graph displays the number of job openings and starts.