Understanding the Lead Dashboard
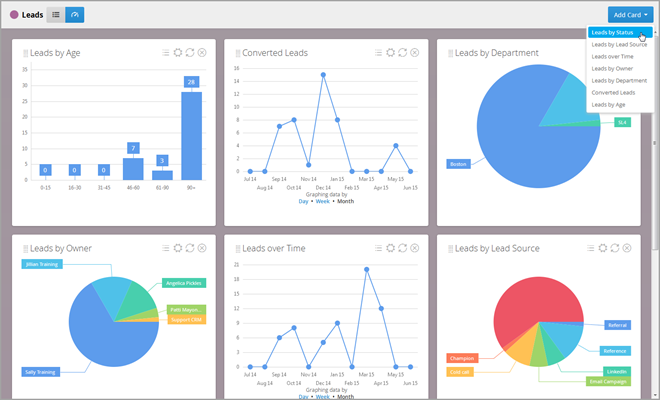
The lead list features a dashboard view that, composed of cards, allows a more visual insight into your metrics. To view the dashboard, click the Dashboard button  at the top of the lead list (to the left of the search field).
Adding Dashboard Cards
By default, your dashboard will be empty. To start adding content:
-
Click Add Card in the upper-right corner.
-
Browse cards organized by entity.
-
Select the cards you want to display.
Once added, each Dashboard Card can be customized to reflect your specific data needs.
You can:
-
Configure data
 by applying filters (e.g., company, industry, owner, or date range) and rename the card accordingly.)
-
Filters are sticky, meaning they remain in place until you remove the card or reset them manually.
-
-
Switch views between a list
 or a graph
  (available for certain cards).
 -
Drag and drop
 cards to rearrange your dashboard layout.
 -
Add duplicate cards and apply different filters or titles to compare views (available for certain cards).
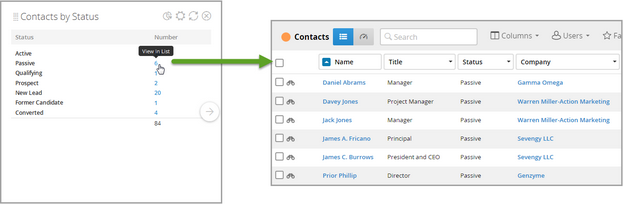
In list view, any blue number is clickable. Select it to open the corresponding entity’s list view and explore the data in more detail.
To make sure you’re seeing the most recent data, manually refresh each card regularly.
Available Dashboard Cards
See Lead Dashboard Cards for a list of available cards.