| Edition: Enterprise & Corporate | Audience: Gamification Admin |
Creating a Leaderboard Slide
This article explains how to create a Leaderboard Slide in a Gamification channel.
Leaderboard slides are used to display top performers in leaderboard format against a specific metric in the Bullhorn Analytics account.
How to Create a Leaderboard Slide
- In Admin > Gamification, select or add a channel to add the Leaderboard slide to.
- Click the +ADD SLIDE button at the bottom of the page.
- Select Leaderboard Slide from the Slide Type dropdown, then configure the fields as detailed below.
In Gamification, it's not possible to have a Group vs. Group leaderboard (can only be individual users) but you can use a Trend Slide to achieve the same thing. A Trend slide can have up to 4 lines, and each of these can be a different Group.
Main Configuration
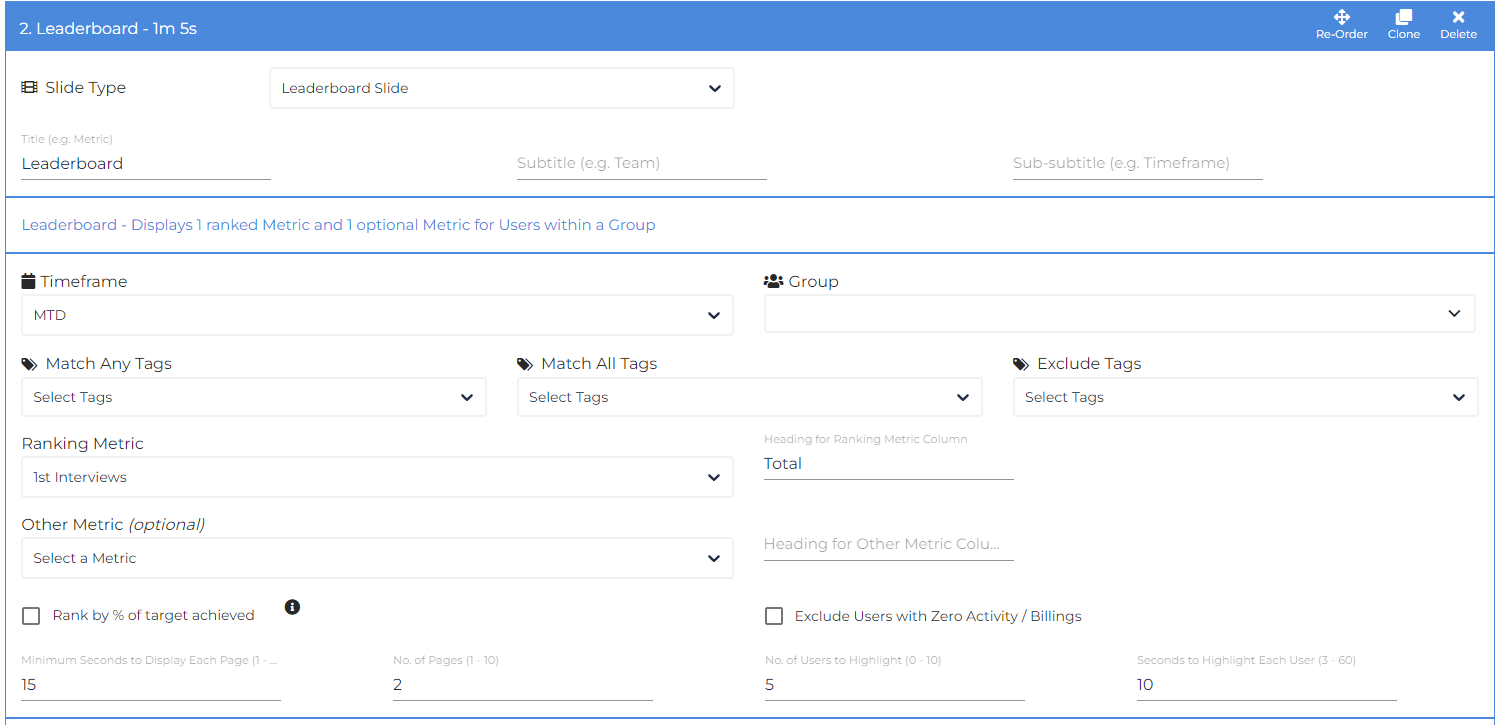
- Title / Subtitle / Sub-subtitle: You have three options to use for relevant details (e.g. [Metric or Headline Name] - [Team Name] - [Timeframe] / "Top Billers - London - MTD")
- Timeframe: Choose the timeframe for the leaderboard.
- Group: Choose to only show a specific group on the leaderboard.
- Match Any Tags / Match All Tags / Exclude Tags: Use these options if you want to further segment the users that will be displayed (e.g. exclude a cohort with a specific tag applied).
- Ranking Metric: Select the metric used to score the leaderboard.
- Heading for Ranking Metric Column: Choose a title for the column displaying the ranking metric (e.g. "Total").
- Other Metric: This is an optional, non-ranking additional metric that can be shown on the leaderboard before the ranking metric to provide supporting information (e.g. Total Sales (Ranking) and Placements (Other))
- Heading for Other Metric Column: Choose a title for the column displaying the non-ranking metric (if required).
- Rank by % of target achieved: Check this option if you want the ranking to look at % attainment of target rather than total volume. Users with no target will be excluded.
- Exclude Users with Zero Activity / Billings: Check this option if you want to exclude users with a ranking metric 0 value.
- Minimum Seconds to Display Each Page / No. of Pages / No. of Users to Highlight / Seconds to Highlight Each User: Use these options to apply changes to slide length, number of users to display, and highlighted users. The impact on the overall slide length will be shown next to the slide title.
Once you've completed the main configuration, you can add further information to the slide to enhance the leaderboard visualisation.
Top Performers
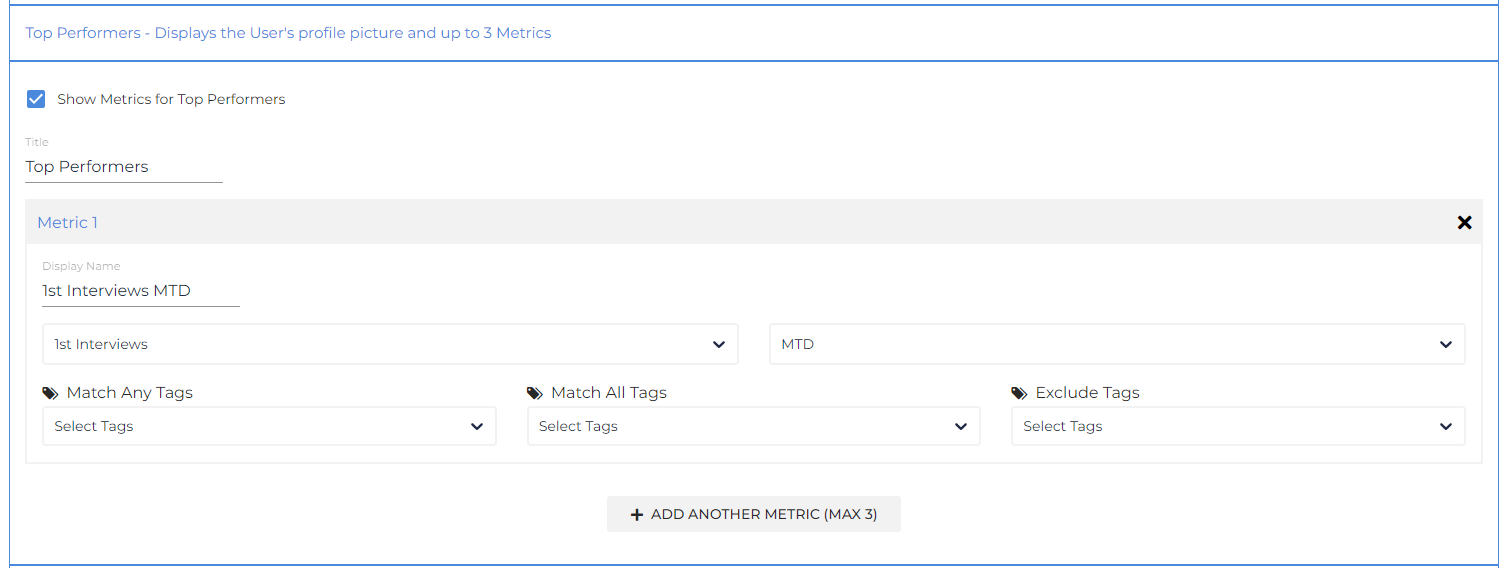
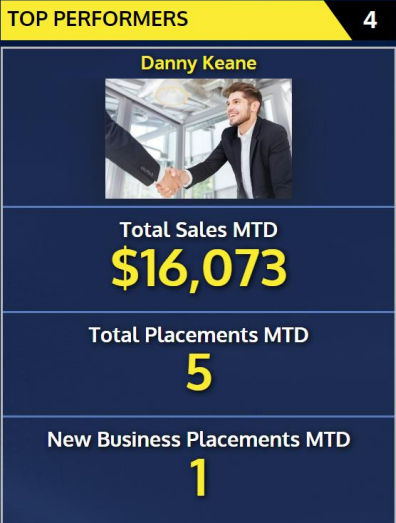
The Top Performers section allows for up to three additional metrics to be shown beneath the user's picture. You can select from any metric in the account, over any time period, and you can use Tags to segment if required.
For example, you could have Total Sales MTD, Total Placements MTD, and New Business Placements MTD as the options to display under the top performing users' profile pictures:
Group Overview
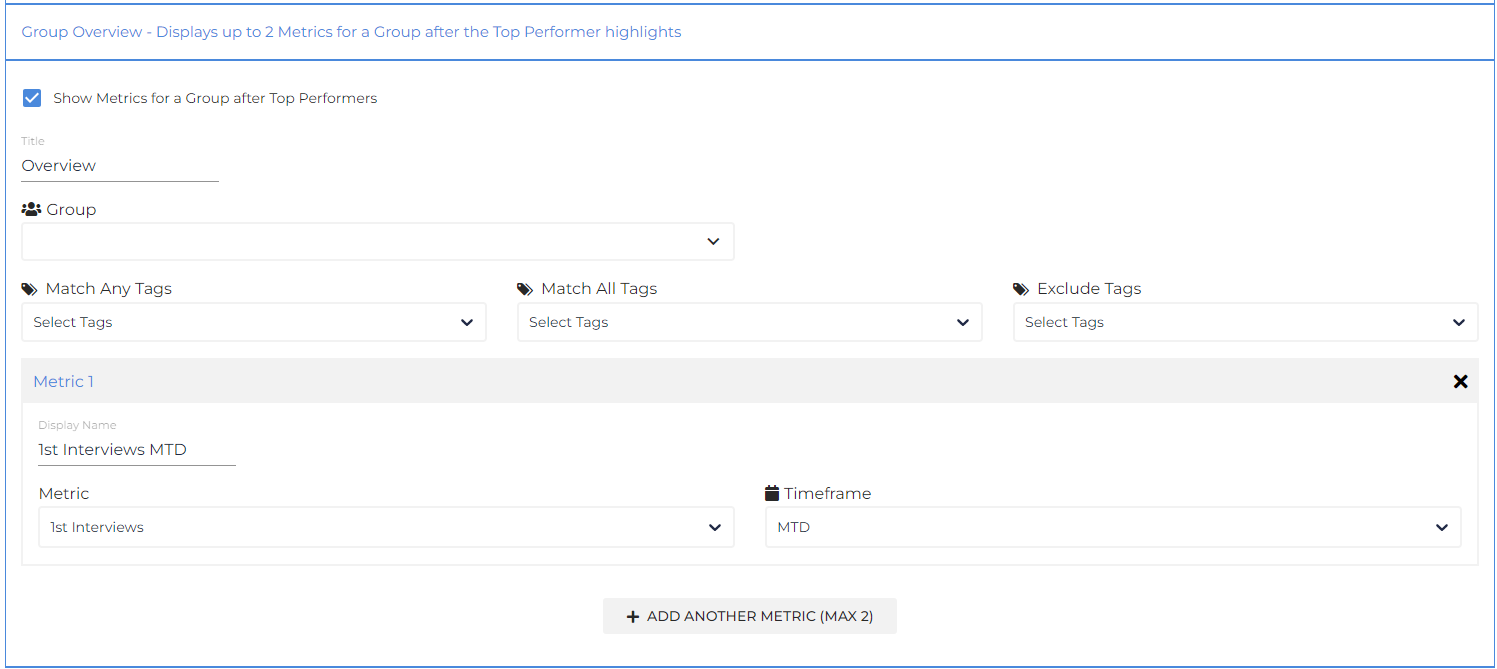
Group Overview works in the same way as Top Performers, but shows the data for either a specific group or the entire business. This option will appear after all highlighted users have been shown. You can select up to two metrics to display. These metrics will be for the same group and will have the same tag restrictions if set.