| Edition: Enterprise & Corporate | Audience: Gamification Admin |
Creating a Gamification Trend Slide
This article explains how to create a Trend Slide in a Gamification channel. Trend slides show how well a group or the business is performing against a previous time period.
How to Create a Trend Slide
- In Admin > Gamification, select or add a channel to add the Trend slide to.
- Click the +ADD SLIDE button at the bottom of the page.
- Select Trend Slide from the Slide Type dropdown.
- Add relevant details for the slide into the Title, Subtitle, and Sub-subtitle fields (e.g. [Metric or Headline Name] - [Team Name] - [Timeframe]).
- Configure the Trend Chart and Metric Summary sections as detailed below.
In Gamification, it's not possible to have a Group vs. Group leaderboard (can only be individual users) but you can use a Trend Slide to achieve the same thing. A Trend slide can have up to 4 lines, and each of these can be a different Group.
Gamification Trend Chart Configuration
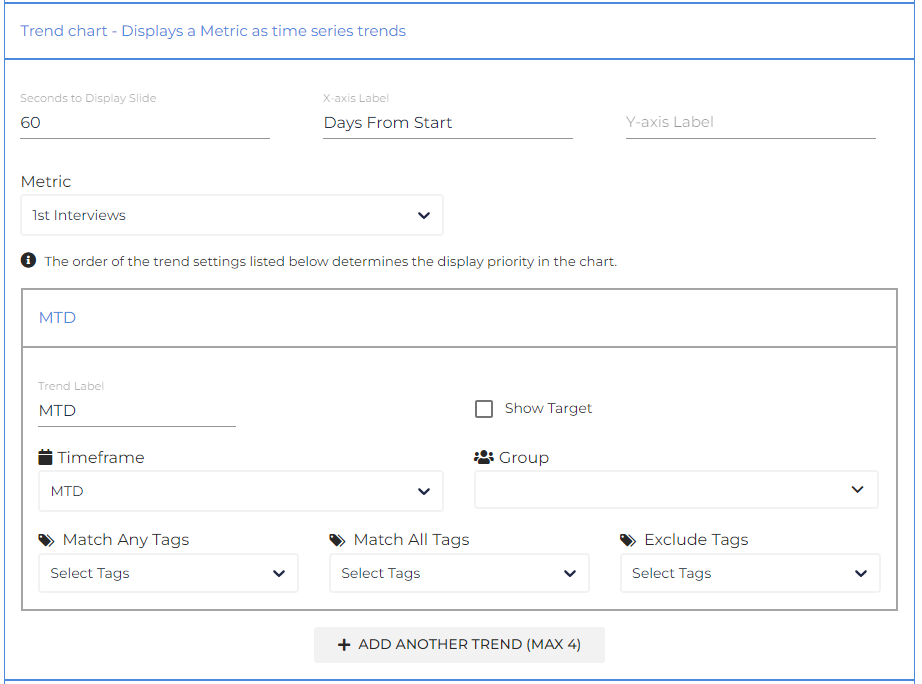
Up to four trends can be shown on a trend slide. Each trend can look at any fixed time period and a single group level in the business. Tags can also be used in each trend.
- Seconds to Display Slide: Choose how long this slide should be displayed in the channel.
- X Axis Label / Y Axis Label: The X-Axis Label will default to "Days From Start". This option doesn’t need to be amended. The Y Axis label can be edited if needed to show what is being measured on the trend.
- Metric: Choose a metric to trend in the slide. All available metrics that can be used will appear in the dropdown.
Use multiple trends to look at the current month against the previous month to see whether the business is performing better in that specific metric, and if so, at which point in the period this happened.
Using Targets in a Gamification Trend Charts
To use a Target in a Gamification Trend Slide, make sure the Group, Metric, and Timeframe settings match the configuration of your slide. You’ll also need to check the Show Target box for it to display.
Remember, Targets can only be created in Targets Admin. Each Target is linked to a Metric, Timeframe (weekly or monthly) and User or Group.
Common Issues to Watch For:
-
Mismatched settings: If the Metric, Timeframe, or Group of the Target does not line up with your Trend Slide, the Target won’t display.
-
Unchecked box: Forgetting to tick the Show Target box means your Target won’t appear, even if it’s configured correctly.
-
Overlapping Targets: In most cases, you’ll only want one Target per Metric/Timeframe/Group combination. If you do need more than one, consider using different Groups or Timeframes so each Target is distinct and easy to interpret.
Gamification Metric Summary Configuration
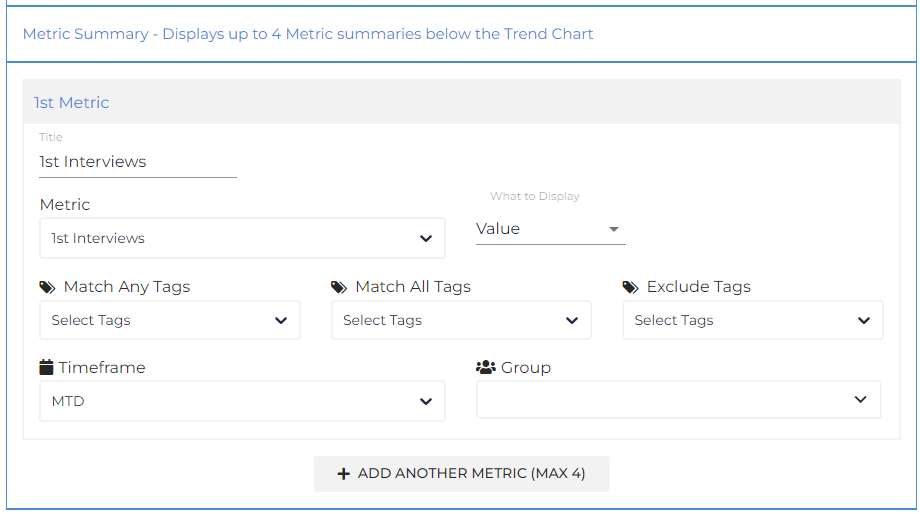
In the Metric Summary section, you can add up to four additional metrics showing the value, the target set for the chosen metric or the expected target (how much of the target set should have been achieved within the current timeframe).
You can choose to display any metrics here, but it is most impactful if they are related to the trend chart.
Triangle icons will appear in the corner of the additional metric containers if there is a target set against that metric. The icons will be coloured green, yellow or red to indicate the status of progress against that target, as per the priority metrics in OneView.
- Title: Enter a title to display for this metric.
- Metric: Select a metric to display.
- What to display: Select the information to display for this metric.
- Match Any Tags / Match All Tags / Exclude Tags: Use these options if you want to segment the users that will be displayed (e.g. exclude a cohort with a specific tag applied).
- Timeframe: Choose a timeframe for the data. This must be one of the preset options and cannot be a custom time period.
- Group: Choose the group whose data needs to be displayed.
Look at the same metric (e.g. Total Sales) four times, with the first metric looking at last month's value, the second looking at this month's value, the third as the target for this month, and the fourth looking at the expected target for the month.
This will show how the group/business compares against the previous month, what the target is, and the progress of the group/business against its target for the chosen metric.