Creating a Crosstab Report from Scratch
While you can convert a list report in Bullhorn Reporting (previously Canvas) to a crosstab, it doesn’t give you the ability to really customize that report for your needs the way creating it from scratch does. Below you will see how to create a simple crosstab report using the Toolbox. You will be able to use this concept to confidently create any number of crosstab reports you need.
Creating the Crosstab Framework
Steps
We will begin by inserting a crosstab into our report studio and populating it with our desired fields.
From Menu, select Canvas, and then click Add.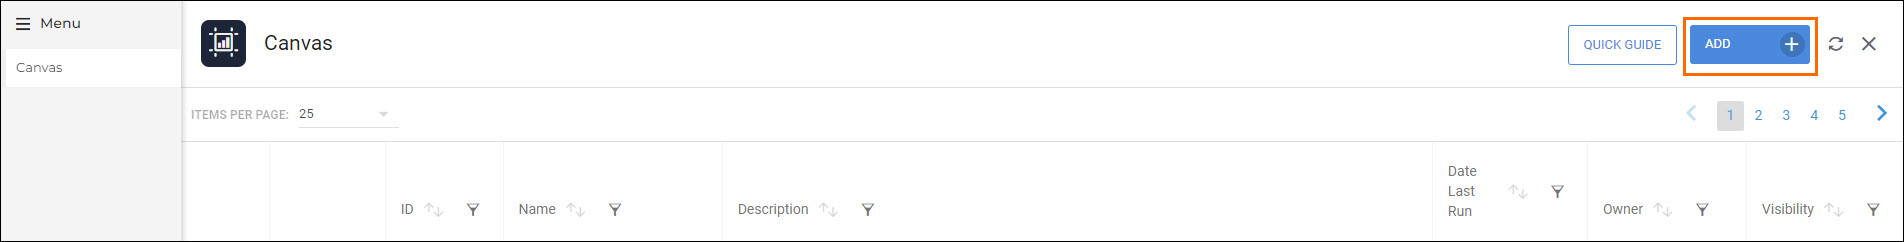
In the Name field, enter your desired report name then choose a Visibility before clicking Next.
Under Insertable Objects, select the Toolbox tab, then double-click Crosstab.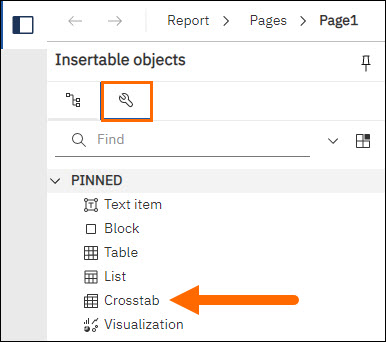
In the Object and query name pop-up, in the Name field, type your desired name and then click OK.
Under Insertable Objects,select the Sources tab > User Activity Analysis > User.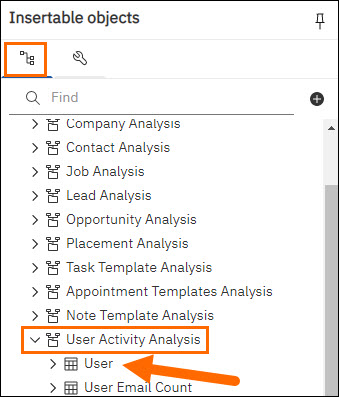
Click and drag Primary Departmentto the Rows section of the crosstab.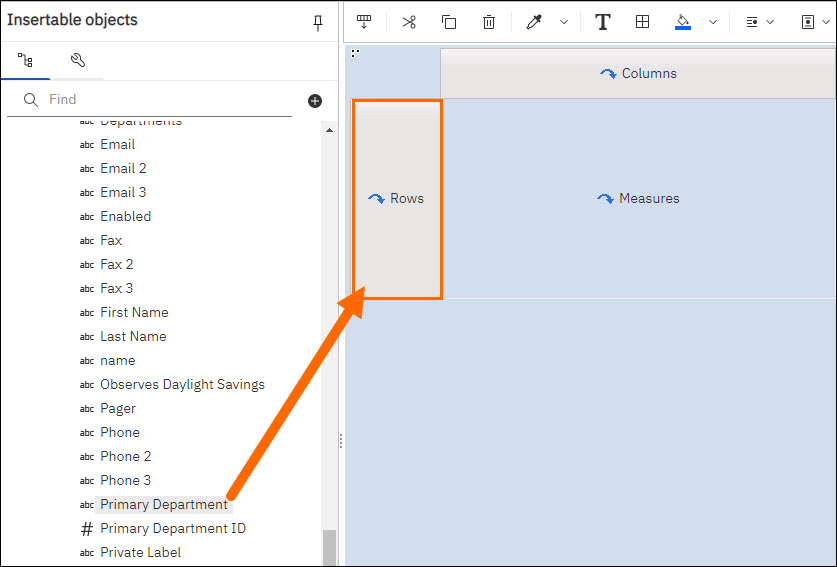
From the same section, drag Name just to the right of Primary Department.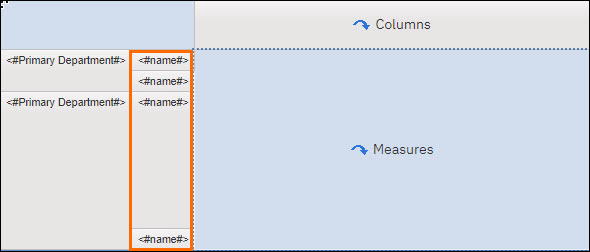
From the same User Activity Analysis, expand Candidate Owned and Candidate Placement.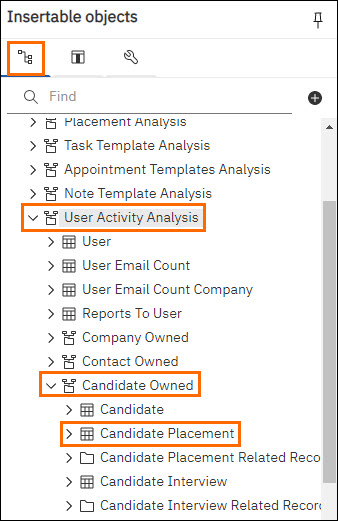
Click and drag Placement Count to the Columns section of the crosstab.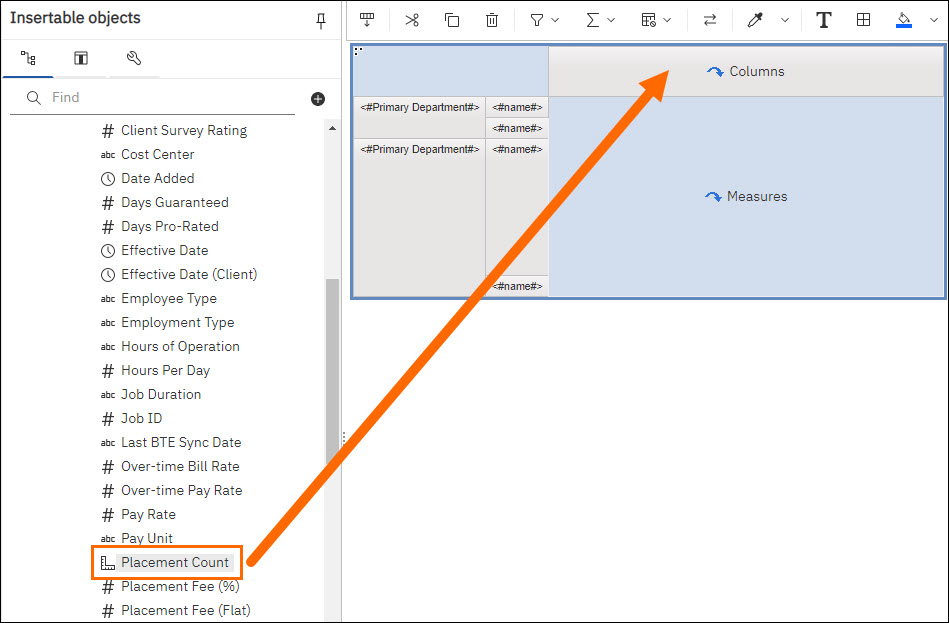
From the same Candidate Owned, expand Candidate Interview, then click and drag Interview Count to the right of Placement Count.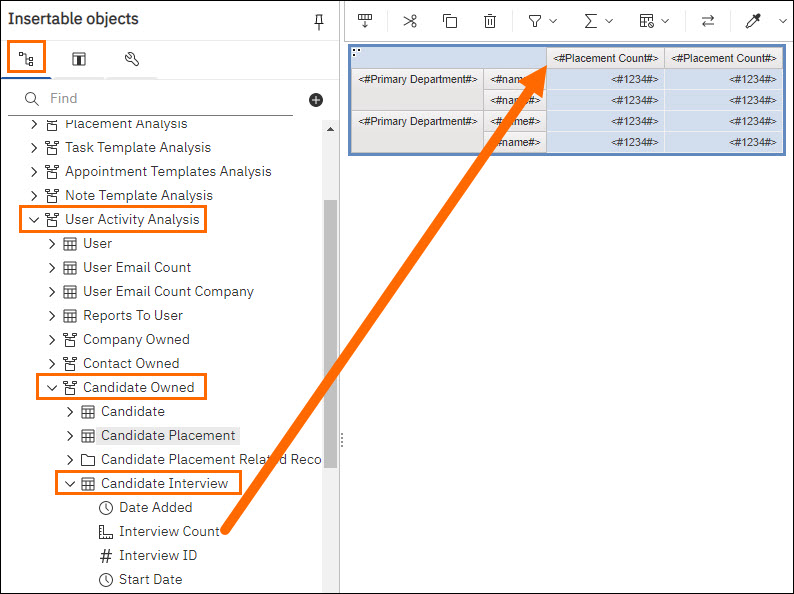
From the same Candidate Owned, expand Candidate Client Submission, then click and drag Client Submission Count to the left of Interview Count.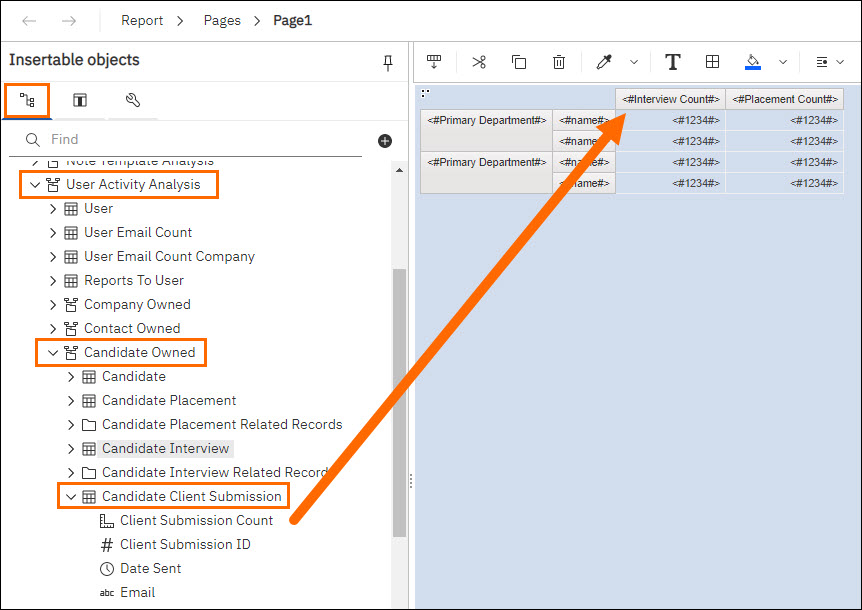
From the same Candidate Owned, expand Candidate Submission, and then click and drag Submission Count to the left of Client Submission Count.
Summarizing the Data
Now we’re going to tell Bullhorn Reporting to add up each column by department and for the company as a whole.
Highlight the report by selecting the 3 dots on the upper left corner of the table.
In the Show properties pane, under Data. Choose Summarize and then Total.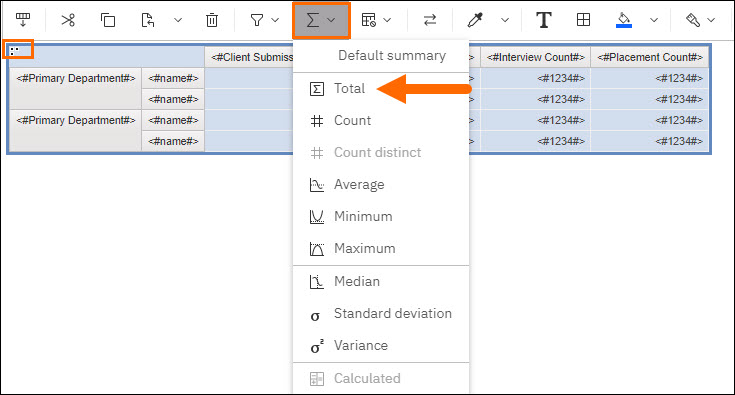
Tailoring Field Names
Finally, we will rename the total cells so that it’s more obvious what each one is summarizing.
In the table, click Total.
From the the toolbar, select More, then click Edit Data Item Label….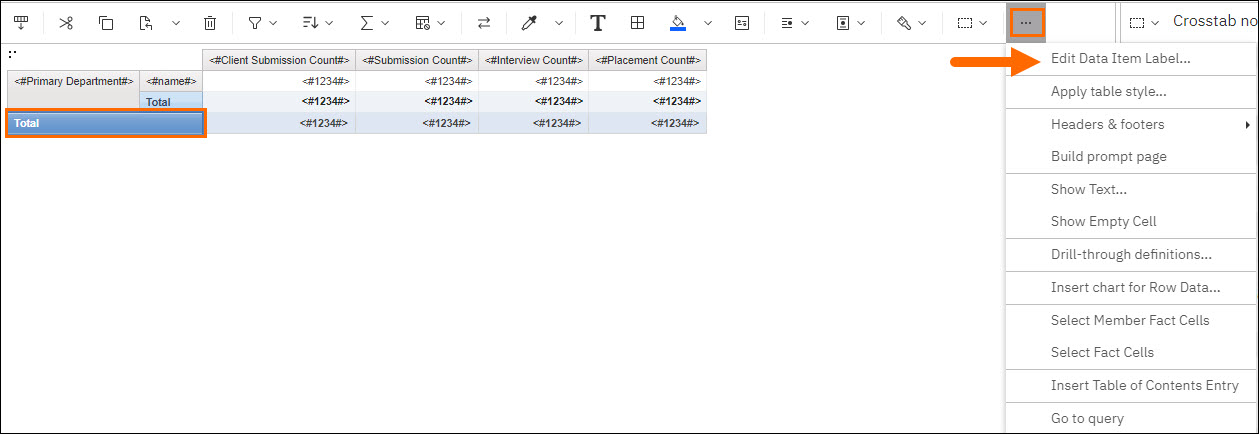
In the Data item label pop-up, under the Data item label field, type “Department Total” and select OK.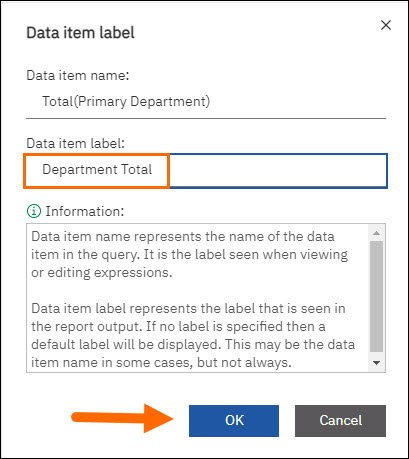
Repeat the last three steps for the other Total cell in the table and rename it “Company Total”.
Once you’re done editing, Save the report.
You can add additional columns or sub-columns as desired. You can also use filters, formatting, etc. as desired to really make this report yours.
You’re done creating your custom crosstab report!