| Edition: Enterprise | Audience: All Users |
Creating Dashboards
Custom dashboards give you a consolidated view of your team's performance and key business metrics. . For AI help in creating your Dashboard, see Build Analytics Dashboards with Amplify.
To create or edit custom dashboards, you need to be an Enterprise Edition user with the Full Dashboard Editing Abilities permission. If the + New symbol is missing from your sidebar, contact your Bullhorn Analytics administrator to enable this for you.
Creating a New Dashboard
Follow these steps to build and save a new dashboard from scratch. To edit an existing dashboard, see Editing Dashboards.
-
Go to the Dashboards module at the top of the Bullhorn Analytics screen.
-
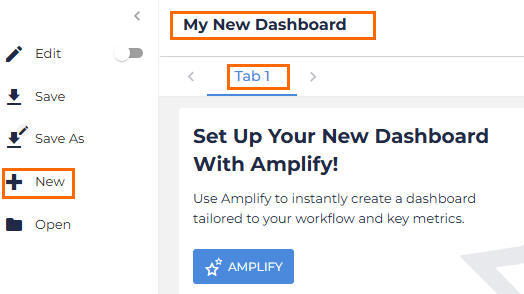
Select + New from the sidebar menu. Your new dashboard will display Tab 1 by default.
-
Enable edit mode by selecting the edit icon
 or by sliding the Edit toggle to the ON position.
 -
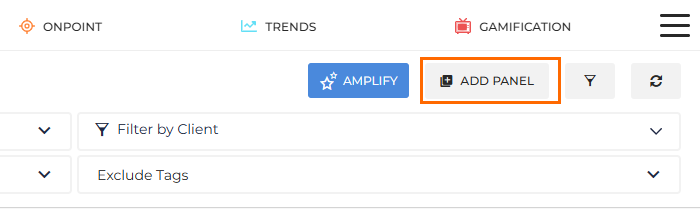
Select Add Panel from the top of the dashboard. This will open the panel selection window.
-
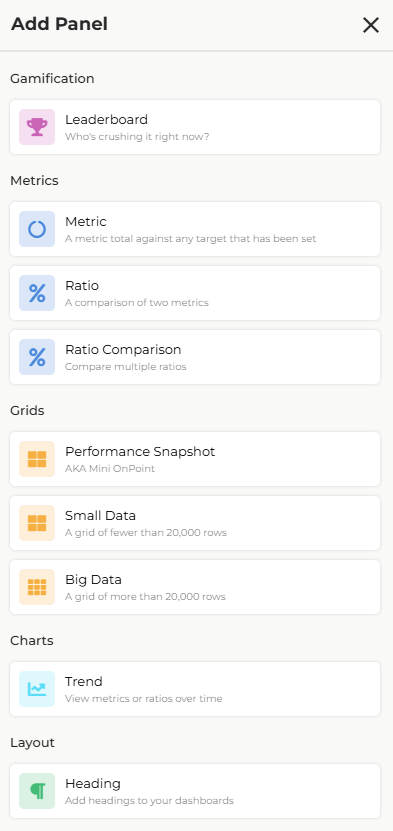
Choose the type of panel you want to add (e.g., Chart, Grid, Metric).
-
Configure the panel by selecting your desired metrics and applying filters.
-
Select Apply to add the configured panel to your dashboard canvas.
-
Repeat steps 4–7 to add further panels. To organize your panels across multiple tabs, see Working With Tabs in Editing Dashboards.
-
Once you are finished, select Save.
For a detailed breakdown of each panel type, see Dashboard Panel Options. For AI assistance when building panels, see Build Analytics Dashboards with Amplify.
Once you've created your dashboard, you can customize its appearance with background colors, images, and gradients. See Customize Dashboard Appearance in Editing Dashboards for details.
If you cannot find the specific metric you need, it may be part of a different panel type. For example, some ratio metrics are only available in the Metric panel, not the Chart panel.
For a walkthrough on building Dashboards, see Analytics Dashboards Webinar and Guides.
If your organization has Gamified Dashboards enabled, you will see a type selection screen when creating a new dashboard. See Gamified Dashboards for more information.
Frequently Asked Questions
What's the difference between a dashboard and a panel?
A dashboard is the main canvas that holds all your panels. A panel is an individual component on that canvas, such as a chart, grid, or metric tile.
How many panels can I add to a dashboard?
There is no hard limit, but performance may slow down if you add too many complex panels. If your dashboard is getting crowded, use tabs to split panels across multiple views. Keep each tab focused on a specific set of business questions for best results.
Who can see my dashboard?
New dashboards are private by default. Only you can see them until you choose to share.
Can I share a dashboard I create with my team?
Yes, you can share with individual users or groups. For instructions, see Managing Dashboards.
Can I rename a dashboard?
Yes. While in edit mode, select the dashboard name to edit it directly.
Why can't I find the metric I need?
Some metrics are only available in specific panel types. If you cannot find a metric in a Chart panel, try adding a Metric panel instead. For a full breakdown of what each panel type supports, see Dashboard Panel Options.
Can I edit a dashboard someone else created?
This depends on the permissions the original owner set. If they shared it with Edit permissions, you can modify it. If they shared it with View permissions, you cannot make changes. You can always use Save As to create your own editable copy.
What kinds of dashboards can I build?
Dashboards are flexible enough to cover most reporting needs. Common examples include:
-
Tracking weekly placements and submissions
-
Viewing open jobs broken down by department
-
Monitoring candidate pipeline health for key accounts
-
Comparing performance across two teams or recruiters
-
Keeping an eye on key metrics like fill ratios and time-to-fill without running a full report.