| Edition: Enterprise | Audience: All Users |
Analytics Dashboards Navigation
The Dashboards page in Bullhorn Analytics is your central hub for viewing and managing your dashboards. Use the sidebar menu, filter options, and navigation tools to explore and customise your data.
You can also customize the visual appearance of your dashboards, including setting background colors, uploading images, and adjusting aspect ratios.
Dashboard Navigation
Use the sidebar menu and dashboard toolbar to manage, edit, and filter your dashboards.
Sidebar Menu
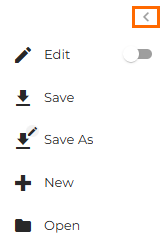
The sidebar menu contains options for creating, opening, and saving dashboards. Use the arrow toggle to collapse it when you need more space.
-
 Edit: Select to enter edit mode on the currently open dashboard. This lets you add,
remove, or rearrange panels. For more information, see
Editing Dashboards.
Edit: Select to enter edit mode on the currently open dashboard. This lets you add,
remove, or rearrange panels. For more information, see
Editing Dashboards. -
 Save: Select to
save any changes made to the currently open dashboard.
Save: Select to
save any changes made to the currently open dashboard. -
 Save As: Select to save a new copy of the current dashboard without overwriting the original.
 -
 New: Select to
create a new dashboard from scratch.
New: Select to
create a new dashboard from scratch. -
 Open: Select to
browse all dashboards available to you, including dashboards you've created and
dashboards that others have shared with you.
Open: Select to
browse all dashboards available to you, including dashboards you've created and
dashboards that others have shared with you.
When viewing a Gamified Dashboard, the canvas displays visible borders indicating the edges of the fixed aspect ratio. Panels outside these borders cannot be saved. You will need to resize or reposition them to fit within the canvas before saving.
Dashboard Toolbar
The dashboard toolbar contains options for filtering, refreshing data, and using Amplify:
-
Refresh: Select the circular arrow icon
 in the top right to update all panels with the most current data from your
Bullhorn system.
in the top right to update all panels with the most current data from your
Bullhorn system. -
Filter: Select the filter icon
 to display or hide the dashboard top-level filters.
 -
Amplify: Select the Amplify button
 to build new dashboard panels using Amplify. See Build Analytics Dashboards with Amplify.
 -
Settings: Select the Settings cog (
 ) on the far right of the toolbar to customize the dashboard appearance, including background colors, images, gradients, aspect ratios, and zoom level. See Customize Dashboard Appearance in Editing Dashboards for details. Note: This is only available to users with dashboard editing abilities.
 -
View Current Tab: On a Gamified Dashboard, this button appears in the top-right corner of the toolbar. It opens the current tab in fullscreen so you can preview how it will appear in presentation mode. You can choose where to start the presentation:
-
Present from this tab: Starts the slideshow from the currently selected tab.
-
Present from beginning: Starts the slideshow from the first tab.
-
This button is only visible on Gamified Dashboards. For full details, see Gamified Dashboards.
Dashboard Tabs
Dashboards support multiple tabs. A tab is a separate section within a dashboard with its own set of panels. Every dashboard starts with one tab by default. You can add more tabs in edit mode, for example to separate panels by audience, time period, or metric theme.

Select a tab to switch between views. For information on adding, renaming, and managing tabs, see Working With Tabs in Editing Dashboards
Pre-built standard dashboards have a single tab and cannot be edited.
Filtering Your Dashboard
The top-level filters narrow the data displayed across all panels on your current dashboard. Changes you make here apply to the entire dashboard unless a panel has been configured with its own custom settings. On initial load, the top-level filters are collapsed by default. Use the filter icon to display them:
 .
.
To reclaim screen space, you can collapse the filter bar when you don't need it. When collapsed, a tooltip displays a summary of any active filters.
Company View Filter
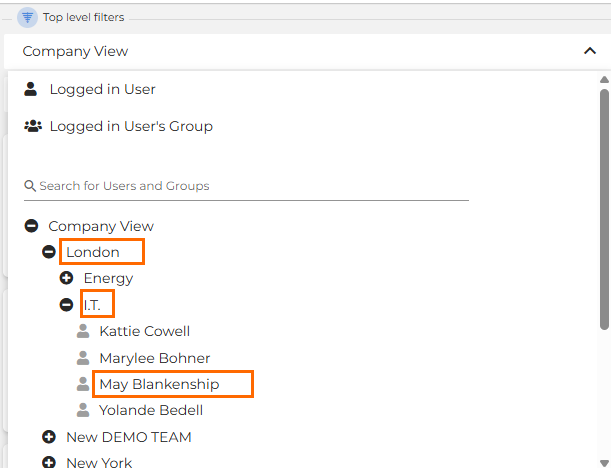
The Company View filter controls whose data the dashboard displays by default.
- To see your own data, select Logged in User from the filter dropdown, then select Load Latest Data. If you save the dashboard with this filter active, it becomes your default view each time you open it.
- To see your team's data, select Logged in User's Group. This shows data for all users in your group.
If you share a dashboard saved with the Logged in User filter, the person you share it with will see their own data by default, not yours. The same applies to Logged in User's Group; the recipient will see their group's data when they log in.
Top-Level Filters
These filters apply across the entire dashboard.
- Group / User Filter: Narrows the dashboard data to one or more specific team members or user groups.
- Time Frame Filter: Restricts the data to a specific time period, such as Last Week, This Quarter, or a custom date range.
- Client Filter: Displays metrics for a specific client or a saved Client Set. For more details, see Using the Dashboard Client Filter and Creating Client Sets .
- Tags Filter: Includes or excludes records that have specific tags associated with them.



Panel Filters
Top-level filters like Company View can be overridden within individual panels by using Panel Filters when you are creating or editing a panel. See Editing Dashboards.
Within a panel edit screen, select Using Inherited Dashboard Settings to use the top-level filters, or switch to Using Custom Settings to define your own for that panel. This is useful for quickly toggling between your personal data and your team's data within a single dashboard.

When custom settings are active on a panel, a filter icon appears next to the panel title, giving you a quick visual indicator of which panels have overrides applied without needing to open each one.

Exploring Panel Data
Once your dashboard is loaded and filtered, you can drill down into specific metrics.
- Metric clickthroughs: Select any blue metric or number within a panel to open a new tab showing the underlying records that make up that total. For more information, see Dashboard Metric Clickthroughs and Deeplinking.
Troubleshooting
If something on the page isn't working as expected, review these common scenarios.
- The Edit icon isn't visible: Your user profile doesn't have the permissions needed to edit dashboards. A Bullhorn Analytics administrator will need to enable this permission for you.
- The data seems out of date: Your browser may be showing a cached version of the dashboard. Select the Refresh icon at the top to load the latest data.
- A filter doesn't appear to change the data: Check that you've selected the correct options. If the data still doesn't change, there may be no records that match your filter criteria within the selected time frame. Try broadening the Time Frame filter.
- A dashboard isn't appearing in the Open list: Check both your personal dashboards and the Shared With Me list. The dashboard may not have been shared with you, or it may have been shared with a user group you're not a part of.
Frequently Asked Questions
What's the difference between the top-level User Filter and the Company View filter?
The top-level Group / User Filter changes the data for the entire dashboard. The Company View filter is specific to the panel it's on and provides a quick way to toggle between your personal data and your group's data without changing the dashboard's overall focus.
If I apply a Time Frame filter and save the dashboard, will it always show that same period?
Not unless it's a custom date range. Saving a dashboard with a relative filter like Last Week saves the filter type, not a fixed date range. Each time you open the dashboard, it will dynamically show the previous week's data.
How do I share a dashboard with another user?
You can share dashboards from the Open menu. For full details, see Managing Dashboards.
Can I customise a dashboard that someone shared with me?
No, but you can make your own copy of it. Select Save As from the sidebar to save a personal copy of the dashboard. You can then edit your copy freely without affecting the original or requiring edit permissions on the shared dashboard.