| Edition: Enterprise | Audience: All Users |
Editing Dashboards
Edit mode lets you build and refine your dashboards, including rearranging panels, managing tabs, and configuring filters. Users with basic editing access can adjust the dashboard layout. Users with full editing access can also add and edit panels.
Only Enterprise Edition users can create or edit dashboards.
Switching to Edit Mode
To edit a dashboard, select the edit icon  in the sidebar menu or open the sidebar menu and slide the Edit toggle to the ON position:
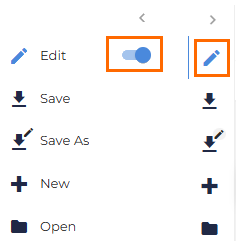
The Edit and Add Panel functions are available based on the permissions set on your profile. If you cannot see these options, your Bullhorn Analytics administrator will need to enable the permissions for your profile. See Enabling Dashboards.
Renaming a Dashboard
To rename a dashboard while in Edit mode, select the dashboard name to edit it directly.

Customize Dashboard Appearance
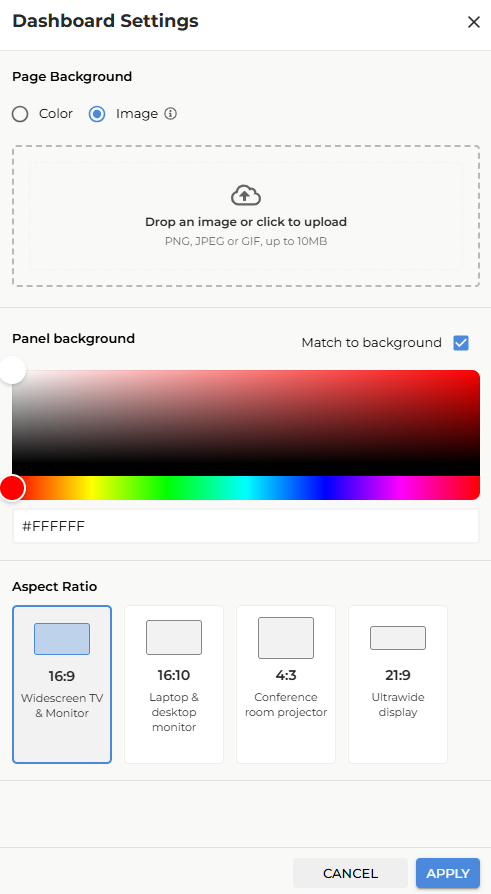
As a dashboard owner with editing permissions, you can customize the visual appearance of your dashboards to match your team's branding or personal preferences. You can set background colors, upload background images, adjust aspect ratios (for Gamified dashboards), and configure how panels display.
Permission Requirements
Dashboard customization is available only to users with dashboard editing permissions. Users with view-only access will not see the customization options.
Accessing Dashboard Settings
To access the Dashboard Settings slideout:
- Go to the dashboard you want to customize.
- Select Edit mode.
- Click the dashboard Settings cog (
 ) on the far right of the tabs row to open the Dashboard Settings slideout.
 - Make your changes and click Apply.
Set a Background Color
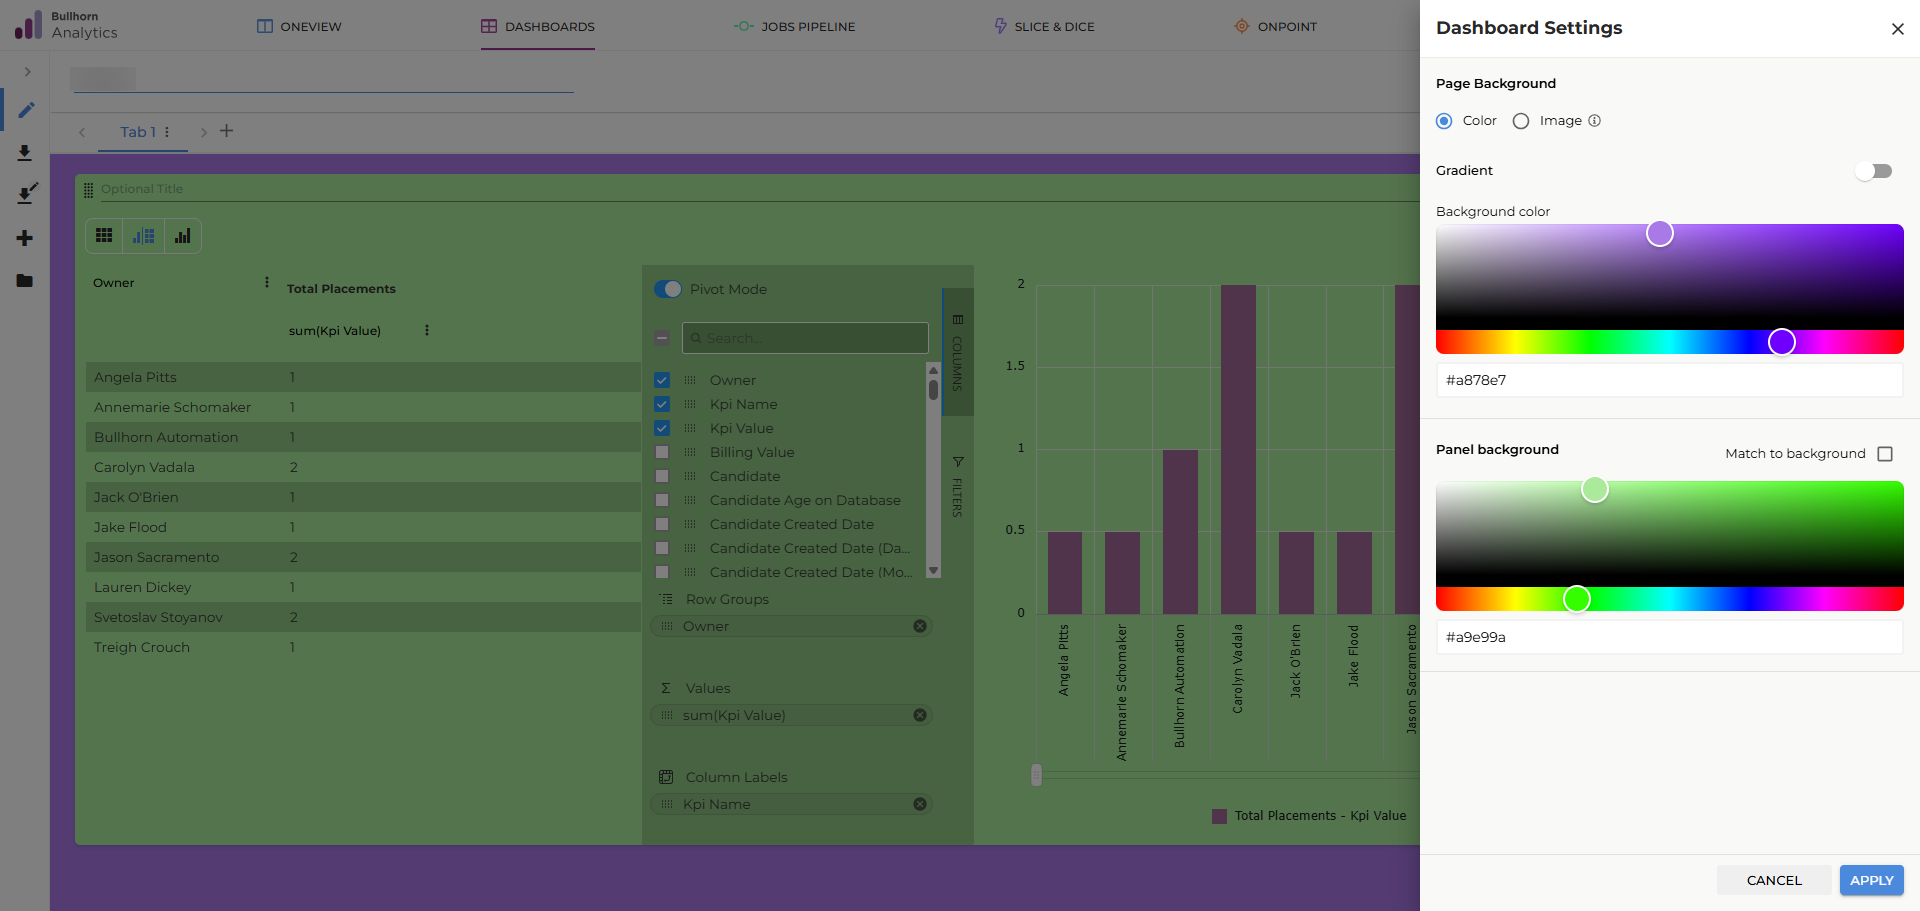
You can set a solid background color for your entire dashboard. This color applies to all tabs on the dashboard.
- Click the dashboard Settings cog ().
- Select the Color button in the Page Background section.
-
Use the colour picker or enter a hex color value (e.g., #FF5733) in the Background color field.
-
A preview of your color choice appears in the background before you apply it.
-
- Click Apply to apply the color to all dashboard tabs.
Validation
- Valid hex colors are accepted (e.g., #FF5733, #FFF).
- Invalid hex values (e.g., #ZZZZZZ) will show an error message and are not saved.
- Empty values revert to the default dashboard color.
If you have a background image set, the background color will not be visible. To use a background color, remove any background image first.
Set a Background Gradient
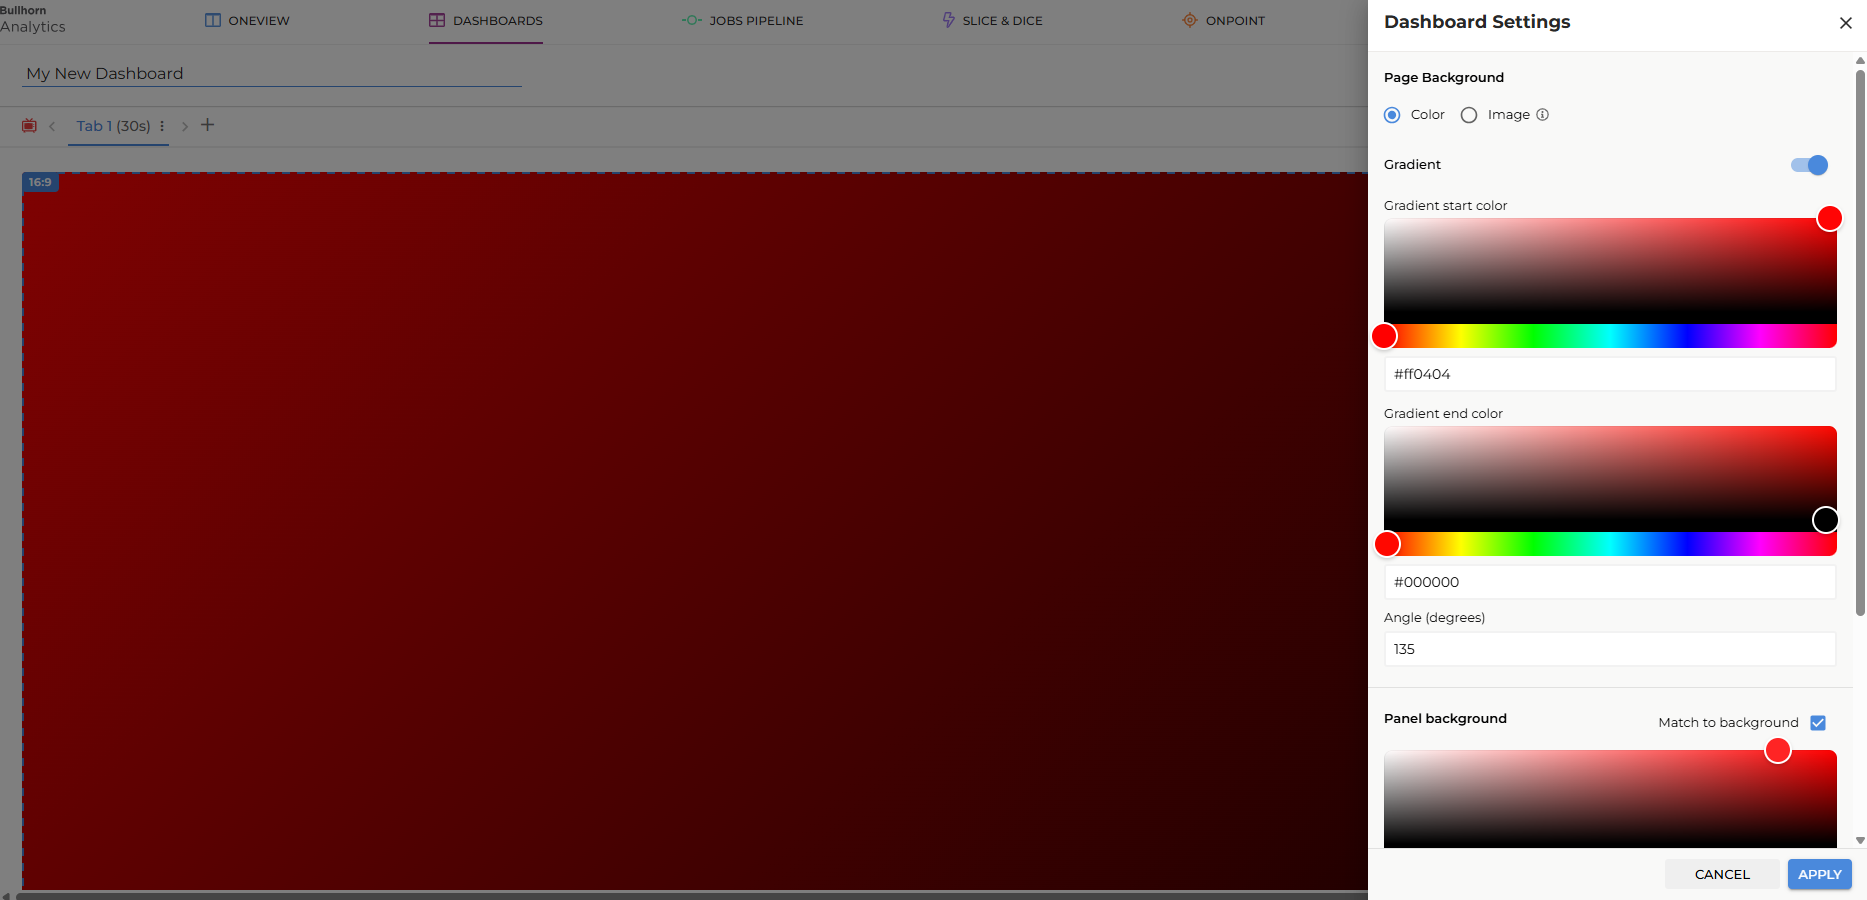
You can set a two-color gradient as your dashboard background, which applies to all tabs:
- Click the dashboard Settings cog ().
-
Select the Color button in the Page background section.
- Toggle Gradient on.
- Set your Gradient start color and Gradient end color using the color picker or by entering a hex color value.
- Optionally, set the Angle (degrees) to control the gradient direction (e.g., 135 degrees).
- A preview of the gradient appears in the background before you apply it.
- Click Apply to apply the gradient to all dashboard tabs.
To switch back to a solid color:
- Click the dashboard Settings cog ().
- Toggle Gradient off.
- Select your solid color using the color picker or by entering a hex color value in the Background color field.
- Click Apply.
Set a Panel Background Color
In addition to the page background color, you can set a custom background color for your panels that is different from the dashboard background.
- Click the dashboard Settings cog ().
- Use the colour picker or enter a hex color value (e.g., #FF5733) in the Panel background section.
- Click Apply to apply the custom panel color to all panels on the dashboard.
The panel background color is independent of the page background color. If you want panels to automatically match the page background color, use the Match to Background setting instead (see Enable Match to Background).
Enable Match to Background
You can enable a setting so that panel backgrounds automatically match your dashboard background color or gradient. This creates a cohesive visual experience across all panel types.
- Click the dashboard Settings cog ().
- Check the Match to background checkbox in the Panel background section
- Click Apply.
All panels on your dashboard will now update to match the background color or gradient.
To disable, uncheck the Match to background checkbox. Panel backgrounds will keep the last color until changed.
Set a Background Image
You can upload an image to display as your dashboard background. The image applies to all tabs on the dashboard.
- Click the dashboard Settings cog ().
- Select the Image button in the Page background section.
- Click in the upload area or drag and drop an image file.
- Click Apply to apply the image to all dashboard tabs.
Supported file types and size limits:
- File types: PNG, JPEG, GIF
- File size: Maximum 10 MB
- Non-image files and files exceeding 10 MB will be rejected with an error message.
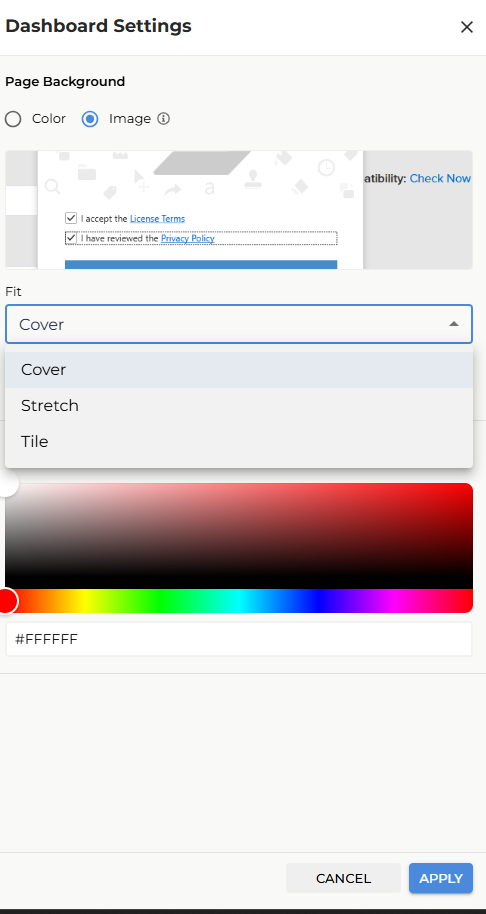
Image Fit Options
After uploading an image, you can choose how the image displays on your dashboard background using the Fit dropdown. The available options are:
-
Cover (default): The image is scaled to cover the entire dashboard background while maintaining its aspect ratio. If the image aspect ratio doesn't match the dashboard, some parts of the image may be cropped.
-
Stretch: The image is stretched to fill the entire dashboard background. This may distort the image if the aspect ratio doesn't match the dashboard dimensions.
-
Tile: The image is repeated (tiled) across the dashboard background to fill the entire space.
You can still Set a Panel Background Color when the page background is an image.
Legal Disclaimer:
When you upload a background image, you are confirming that you have the necessary rights to use that image. Bullhorn Analytics permits users to upload a background image for dashboards, but this does not constitute an authorization by Bullhorn regarding your use of any specific image.
Remove a Background Image
- Click the dashboard Settings cog ().
- Select the Image button in the Page background section.
- Click the Remove button in the upload area.
- Click Apply.
The dashboard background reverts to the previous color (or the default appearance if no background color is set).
Setting a background image overrides any previously set background color.
Change Aspect Ratio (Gamified Dashboards Only)
If your dashboard is a Gamified dashboard, you can adjust its aspect ratio. Note: Classic dashboards do not have this option.
- Click the dashboard Settings cog () on a Gamified dashboard.
- Select a new aspect ratio in the Aspect Ratio section.
- A confirmation dialog appears with the message: Some panels may not fit within the new aspect ratio and may need manual adjustment.
- Click Cancel to discard the change, or Confirm to proceed.
- After confirming, check that all panels fit properly. Panels that no longer fit can be manually adjusted.
- Click Apply to save your changes.
Changing the aspect ratio may require you to manually reposition or resize some panels. No data is lost during this process.
Set Zoom Level
You can adjust the zoom level of your dashboard to suit your screen or viewing setup. Zoom is configurable from 75% to 300% in 25% increments.
- Click the dashboard Settings cog () on the far right of the tabs row.
- In the Dashboard Settings slideout, locate the Zoom setting.
- Select your preferred zoom level from the dropdown.
- Click Apply.
Standard dashboards default to 100% zoom. Gamified dashboards default to 175% zoom for better readability at a distance.
Panels added to the dashboard while zoomed in automatically size themselves to prevent text from overflowing.
Saving Dashboard Customization Settings
All dashboard customization settings are applied immediately when you click Apply. These settings:
- Persist after you reload the page.
- Apply to all users, if shared.
- Apply to all tabs on the same dashboard.
- Are scoped to that individual dashboard only (other dashboards are unaffected).
- Apply consistently whether users access the dashboard in light or dark theme.
Working With Tabs
Dashboards support multiple tabs, with each tab containing its own set of panels. Tabs are visible to anyone the dashboard is shared with, and the tab layout is preserved for all viewers when the dashboard is saved.
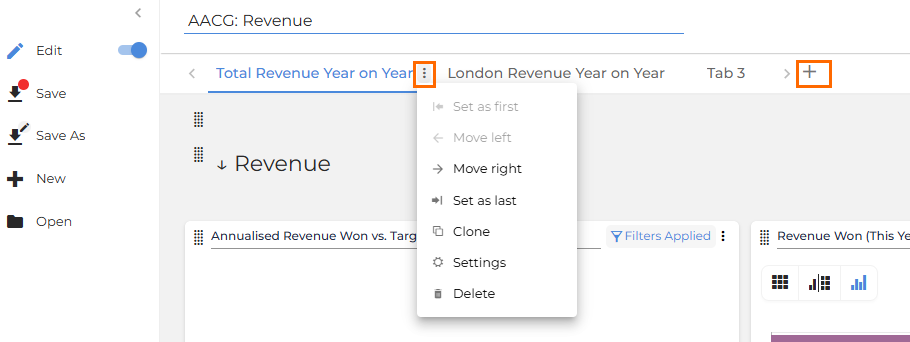
New dashboards start with one tab by default. You can add, rename, clone, reorder, and delete tabs in edit mode.
Pre-built standard dashboards (e.g., Automation, Managers) have a single tab and cannot be edited. To use additional tabs, create a custom dashboard.
Adding a Tab
In edit mode, select the + icon next to the existing tab names to add a new tab.
Renaming a Tab
In edit mode, click the three-dot menu alongside the tab you want to rename and select Settings. Type the new name in Tab name and select Save to confirm.
Tab Settings (Gamified Dashboards only)
Access to Gamified Dashboards requires client-level permission enabled by Bullhorn Support. Contact Bullhorn Support to request access for your organization.
On a Gamified Dashboard, each tab has additional settings that control how it behaves in presentation mode. In edit mode, select the three-dot menu (⋮) on the tab and choose Settings.
The Settings dialog contains the following options:
-
Minimum seconds to display: The number of seconds this tab is shown before auto-advancing in presentation mode. The minimum is 5 seconds; the default is 30 seconds.
-
Skip this tab in presentation mode: Check this box to exclude the tab from the slideshow. The tab remains visible when browsing the dashboard manually outside of presentation mode.
Select Save to apply your changes.
Once configured, each tab displays its duration in brackets in the tab bar (e.g. Tab 1 (30s)). Tabs set to skip show a skip icon in the tab bar.
If you change tab settings while a presentation is actively running on another screen, the presentation must be manually restarted for the changes to take effect.
For information on running presentation mode, see Gamified Dashboards.
Cloning a Tab
In edit mode, click the three-dot menu alongside the tab you want to copy and select Clone. A copy of the tab will be created, prefixed with "Copy of". Rename it as required.
Copying a Tab to Another Dashboard
In edit mode, click the three-dot menu alongside the tab you want to copy and select Copy to.... Select a destination dashboard from the list. Only dashboards you have Edit access to are shown, and the current dashboard is excluded.
The tab is copied as the last tab on the destination dashboard.The destination dashboard opens in Edit mode with the copied tab selected, so you can start working on it right away. If the current dashboard has unsaved changes, you'll be prompted to save first.
If you copy a classic tab onto a Gamified dashboard, check that the panels fit within the aspect ratio. Panels outside the canvas will block Save until you resize or reposition them.
Reordering Tabs
In edit mode, click the three-dot menu alongside the tab you want to reorder and select Move left, Move right, or Set as last to move it to a new position in the tab bar.
Deleting a Tab
In edit mode, click the three-dot menu alongside the tab you want to delete and select Delete. A warning message will appear before you confirm the deletion.
Tab changes are not saved automatically. Select Save before exiting the dashboard to preserve them.
Adding Panels
-
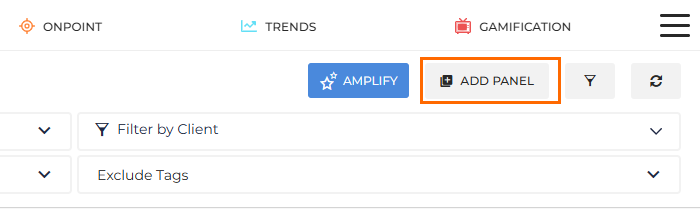
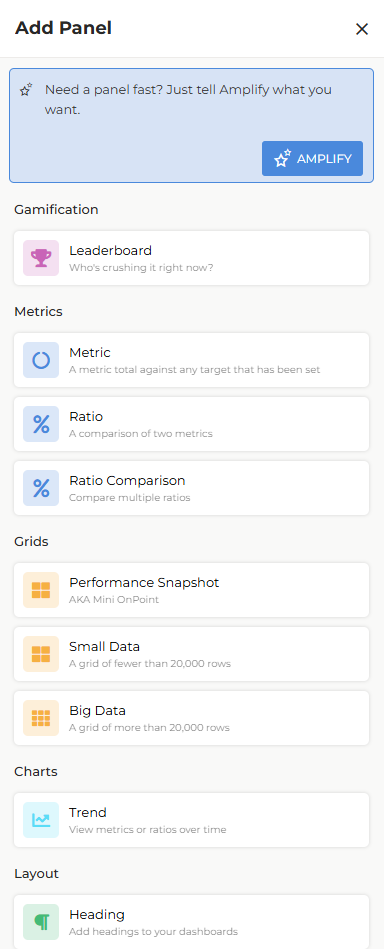
With edit mode enabled, click Add Panel from the top of the dashboard. This will open the panel selection window.
-
Choose the type of panel you want to add (e.g., Chart, Grid, Metric).
-
Configure the panel by selecting your desired metrics and applying filters.
-
Click Apply to add the configured panel to your dashboard. Repeat steps 1–3 to add further panels.
For a detailed breakdown of each panel type, see Dashboard Panel Options. For AI assistance when building panels, see Build Analytics Dashboards with Amplify.
Working With Panels
Each panel on your dashboard supports a range of actions, from expanding and editing to moving, resizing, and downloading data.
Expand Panels
Select the three-dot menu in the top right of a panel and choose Expand to see a full screen version of the panel. Select Collapse to revert.
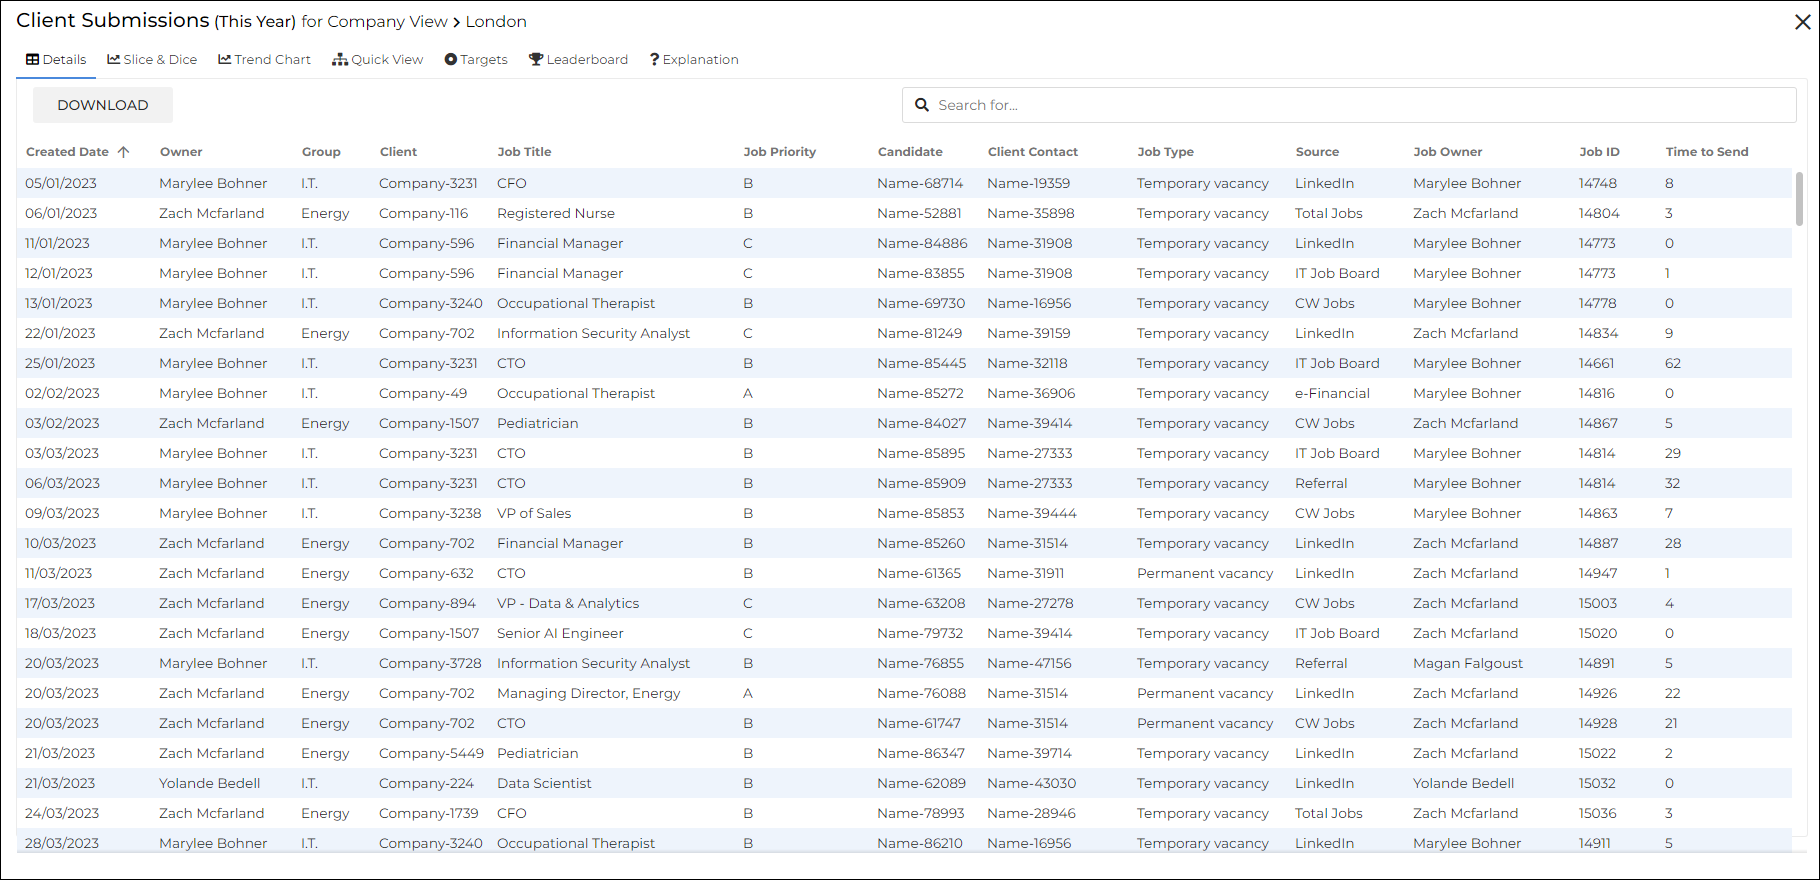
For Metric panels, select the panel to see the detailed data behind it. See Dashboard Metric Clickthroughs and Deeplinking for more information.
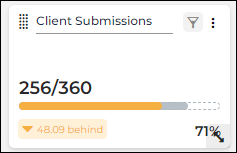
Filter Icon and Tooltips
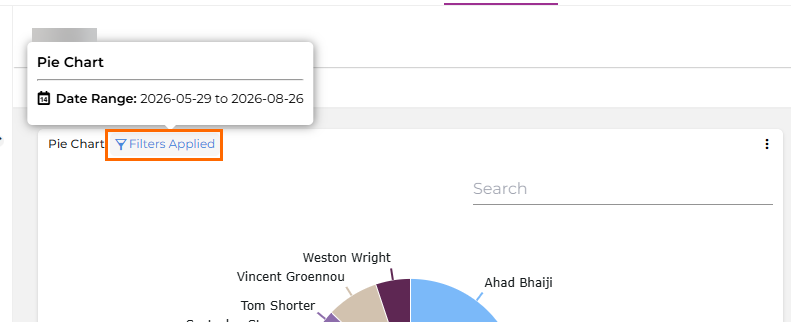
When a panel has an active filter or custom setting applied, a filter icon appears directly next to the panel title. This makes it easy to identify at a glance which panels are using custom settings rather than inheriting the global dashboard filters.
Tooltips display contextual information about panel settings and filters. They automatically adjust their position to remain fully visible within your browser window.
Edit Panels
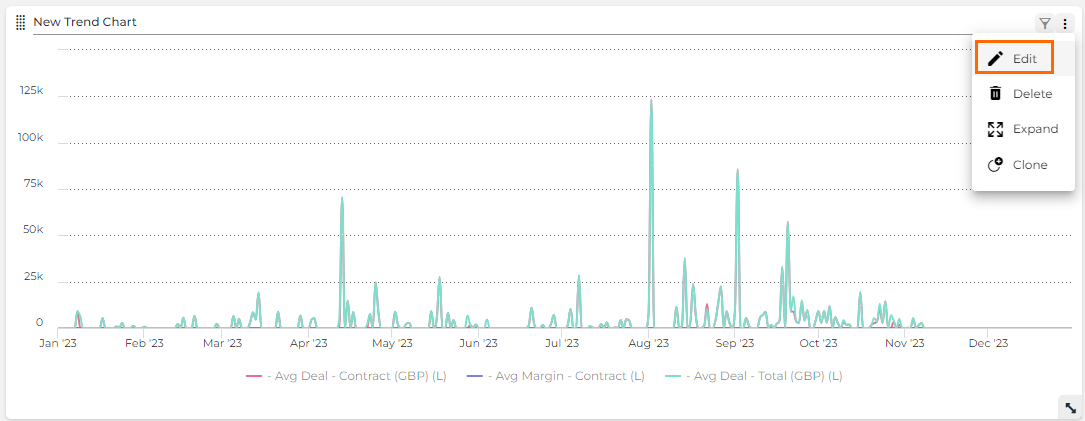
In edit mode, click the three-dot menu and select Edit to reconfigure the panel's attributes, including filters, metrics, and ratios.
Delete a Panel
In edit mode, click the three-dot menu and select Delete.
Duplicate a Panel
In edit mode, click the three-dot menu and select Duplicate to create a copy of the panel on the same dashboard.
Download Panel Data
Click the three-dot menu and select Download to export the data to an Excel file.
Download is only available on Small Data Grid, Big Data Grid, and Trend Chart panels.
Move a panel
Drag the Move icon ( ) to reposition the panel anywhere on the dashboard canvas.
Name a panel
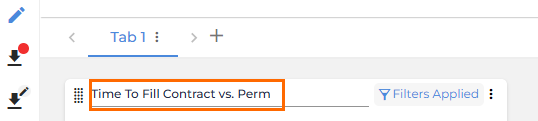
To name or rename a panel, enter edit mode on your dashboard and select the title text on the panel to update it directly.
Resize a panel
Drag the Resize icon ( ) to make the panel larger or smaller.
Overriding Panel Settings
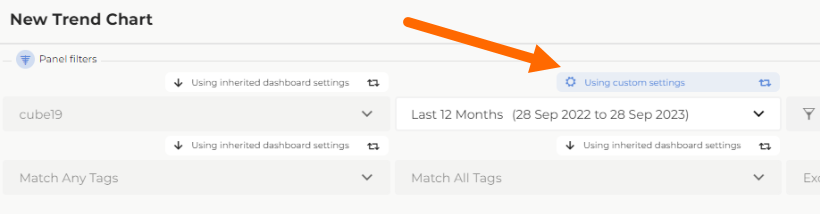
Each panel offers custom settings that allow you to override the global (top-level) filters applied to the main dashboard. When a custom setting is applied to a panel, that panel will not inherit the global dashboard filter for that particular field.
For example, to apply a custom date range to a Ratio Trend Chart panel, select the Using inherited dashboard settings button. The label changes to "Using custom settings" and the filter drop-down becomes active, allowing you to set a custom value for that panel only.
Saving Dashboards
Save Changes to a Dashboard
The Save button displays a red indicator when unsaved changes are present. Click Save  to preserve your changes.

- If you navigate away from the dashboard before saving, your changes will not be kept.
- When you save a shared dashboard, the changes are visible to everyone the dashboard is shared with.
Save as a New Dashboard
To save your changes as a new, separate dashboard:
- Select Save As
 .
. - Enter a name for the new dashboard.
- Select Save.
Frequently Asked Questions
Why can't I see the Edit icon?
Your user profile does not have the permissions needed to edit dashboards. A Bullhorn Analytics administrator will need to enable this for you. See Enabling Dashboards.
If I save changes to a shared dashboard, will everyone see them?
Yes. When you save a shared dashboard, the updated version is visible to everyone it has been shared with immediately. If you want to make changes without affecting other viewers, select Save As to create a personal copy first.
What is the difference between duplicating a panel, cloning a tab, and copying a tab to another dashboard?
Duplicating a panel creates a copy of a single panel on the same tab. Cloning a tab creates a copy of the entire tab, including all the panels on it, within the same dashboard. Copying a tab to another dashboard creates a copy of the entire tab, including all the panels on it, on a different dashboard you have Edit access to.
-
Use Duplicate when you want to reuse one panel's configuration on the same tab in the same dashboard.
-
Use Clone when you want to replicate a full tab layout as a starting point within the same dashboard.
-
Use Copy to... when you want reuse a tab's layout and panels on a different dashboard.
Can I undo changes made in edit mode?
There is no undo option in edit mode. To protect against accidental changes, select Save As before making significant edits. This preserves the original dashboard and gives you a copy to work on freely.
What happens to the panels on a tab if I delete the tab?
Deleting a tab removes it and all the panels on it from the dashboard. A warning message displays before you confirm the deletion. This action cannot be undone, so make sure you no longer need the tab's content before deleting.