Lead Dashboard Cards
This article contains a list of all available Dashboard cards for Leads. For more information about the Lead Dashboard, see Understanding the Lead Dashboard.
You can add individual cards to your dashboard via the Add Card drop-down in the upper-right corner of the page, then drag and drop the cards into your desired order. Some cards allow you to add multiple copies, for use cases such as:
- I'm a manager and I would like to see one card for each of my team members.
- I want to add cards for both this year and last year to compare.
List of Lead Dashboard Cards
- Converted Leads Dashboard Card
- Leads by Status Dashboard Card
- Leads by Lead Source Dashboard Card
- Leads by Age Dashboard Card
- Leads by Department Dashboard Card
- Leads by Owner Dashboard Card
- Lead Aging Dashboard Card
- Leads over Time Dashboard Card
Converted Leads Dashboard Card
-
Location: Lead Dashboard and My Dashboards
-
Allows for Multiple Copies? Yes
How it Works:
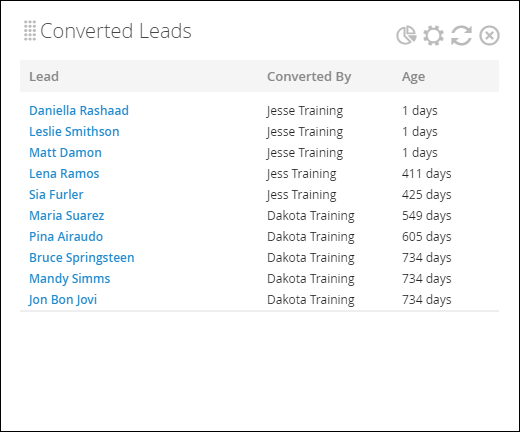
The Converted Leads card shows you all the leads who’ve been converted to a contact, including their first and last name, the owner of their record, and their age (e.g., how long ago they were converted).
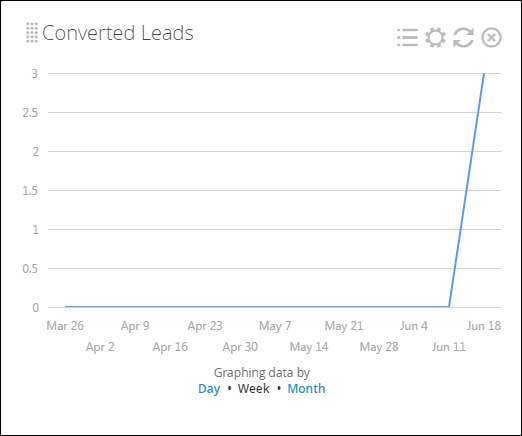
The Graph View displays a line graph where the horizontal is time, and vertical is the number of Leads converted. To change the intervals on the horizontal axis, click Day, Week, or Month where it says “Graphing data by.”
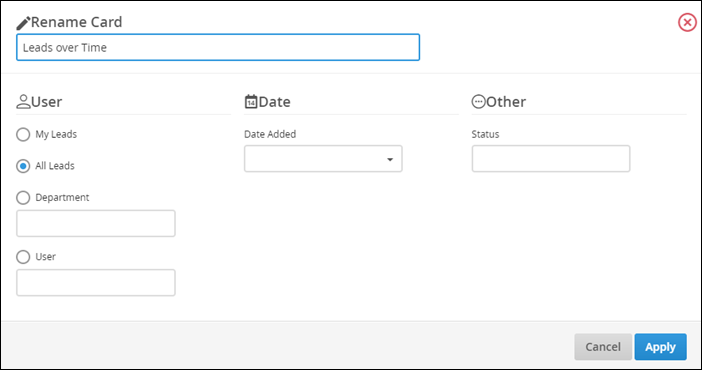
Clicking the gear icon will allow you to filter by My Leads, All Leads, User, or Department, as well as by Date Added or Status.

Leads by Status Dashboard Card
- Location: Lead Dashboard and My Dashboards
-
Allows for Multiple Copies? Yes
How it Works:
The Leads by Status card displays the total number of leads in each status.
If a status is not associated with any lead, it does not display.
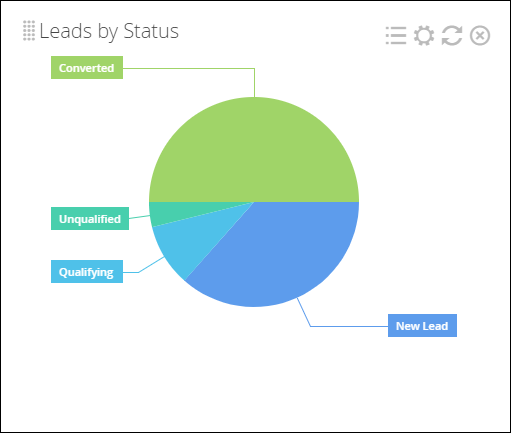
You can also view this information in a list view.
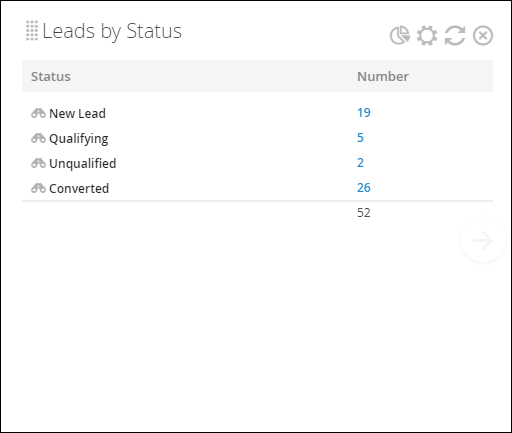
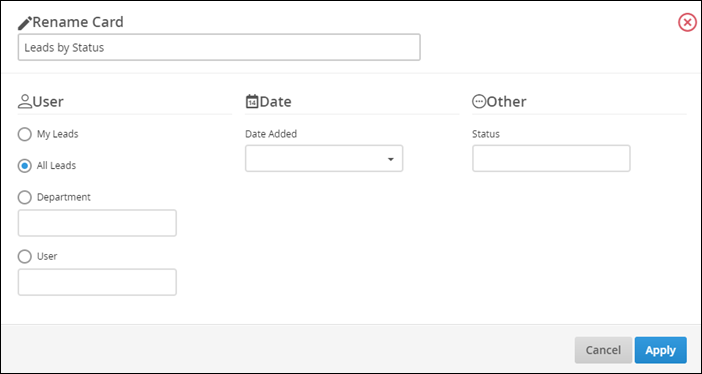
Clicking the gear icon will allow you to filter by My Leads, All Leads, User, or Department, as well as by Date Added or Status.
Leads by Lead Source Dashboard Card
- Location: Lead Dashboard and My Dashboards
-
Allows for Multiple Copies? Yes
How it Works:
The Leads by Lead Source card displays the total number of leads with each lead source.
If a source is not associated with any lead, it does not display.
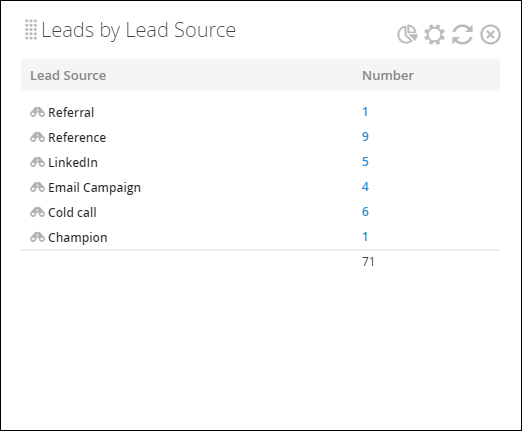
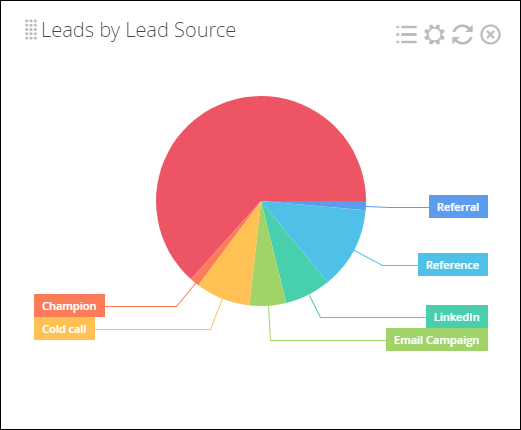
The graph view displays this information in percentages.
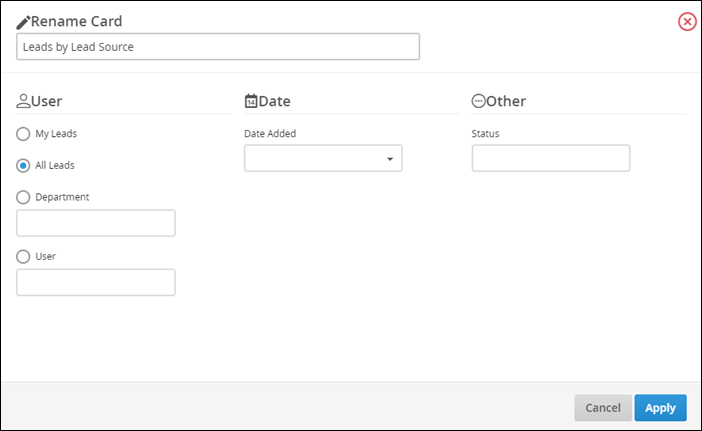
Clicking the gear icon will allow you to filter by My Leads, All Leads, User, or Department, as well as by Date Added or Status.
Leads by Age Dashboard Card
- Location: Lead Dashboard and My Dashboards
-
Allows for Multiple Copies? Yes
How it Works:
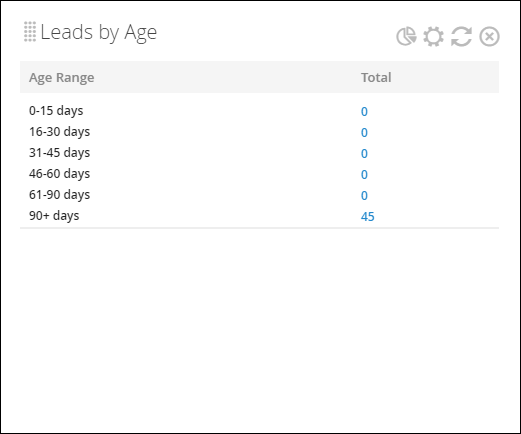
The Leads by Age card shows you a number of different age ranges (0-15 days, 16-30 days, 31-45 days, etc.); meaning, how many days a record has gone without a status change), as well as the total number of leads within each range.
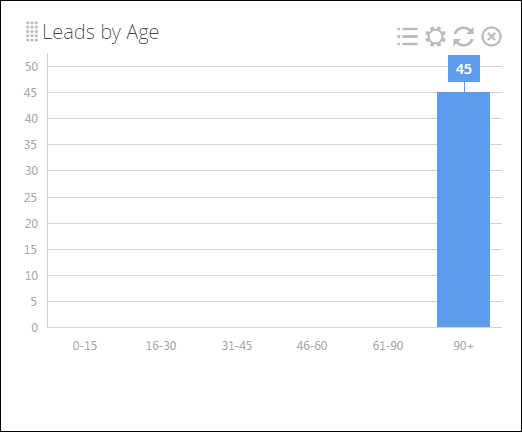
The Graph View displays a bar graph where the horizontal is age, and vertical is the number of Leads added.
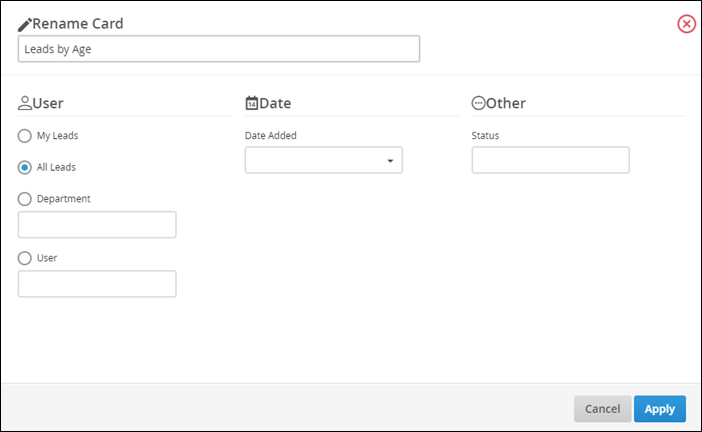
Clicking the gear icon will allow you to filter by My Leads, All Leads, User, or Department, as well as by Date Added or Status.
Leads by Department Dashboard Card
- Location: Lead Dashboard and My Dashboards
-
Allows for Multiple Copies? Yes
How it Works:
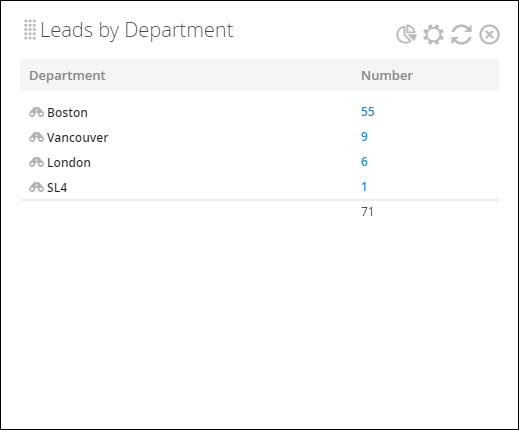
The Leads by Department card shows you the total number of leads each of your organization's departments have added to your database.
If a department is not associated with any lead, it does not display.
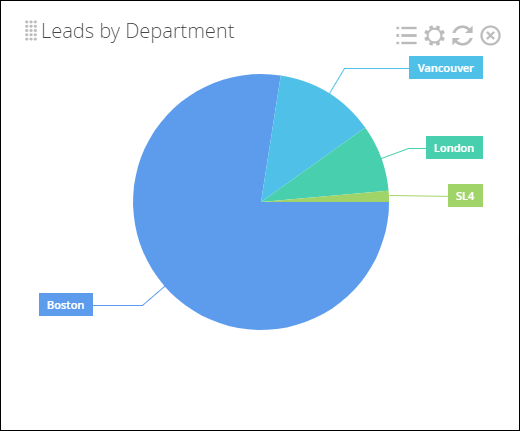
The Graph View displays a pie chart where you can see the percentage of leads added by each department.
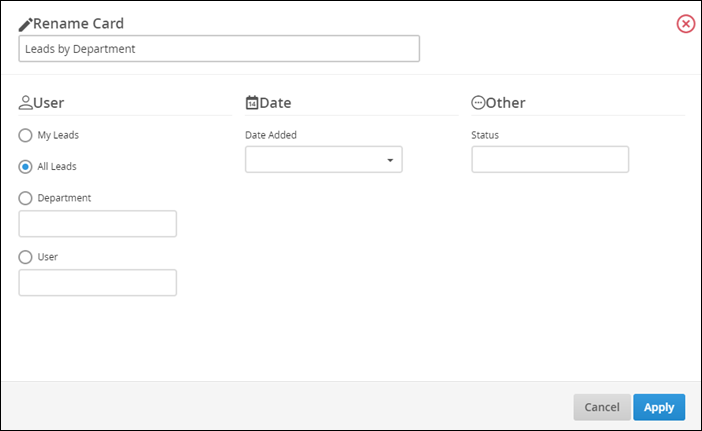
Clicking the gear icon will allow you to filter by My Leads, All Leads, User, or Department, as well as by Date Added or Status.
Leads by Owner Dashboard Card
- Location: Lead Dashboard and My Dashboards
-
Allows for Multiple Copies? Yes
How it Works:
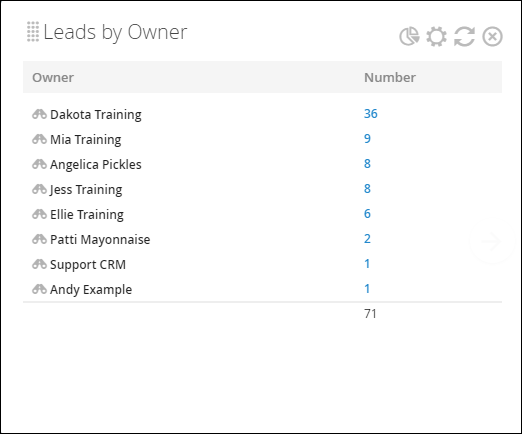
The Leads by Owner card shows you the number of leads added by each Bullhorn user.
On the list view, the sum of each user's leads is displayed at the bottom of the Number column.
The Graph View shows you a pie chart with the percentage of leads per owner.
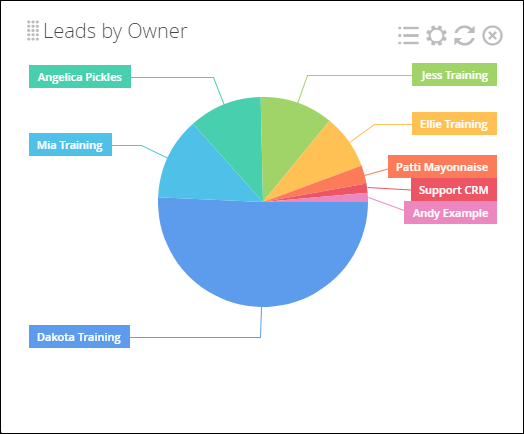
Clicking the gear icon will allow you to filter by My Leads, All Leads, User, or Department, as well as by Date Added or Status.

Lead Aging Dashboard Card
- Location: Lead List Slideout
-
Allows for Multiple Copies? Yes
How it Works:
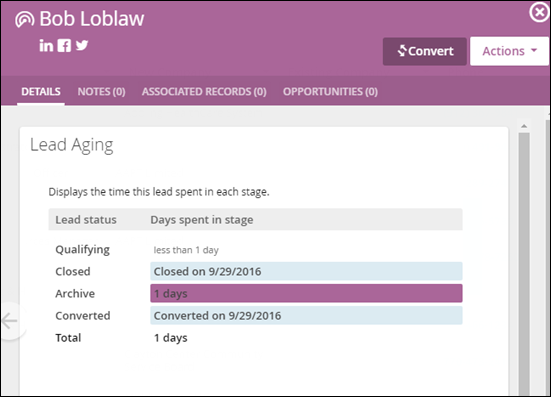
The Lead Aging card appears on the slide-out tab accessed via the Lead list view using the binoculars User-added image.
This card captures the length a Lead spends in each status and shows the date that a status change was made.
Leads Over Time Dashboard Card
- Location: Lead Dashboard and My Dashboards
-
Allows for Multiple Copies? Yes
How it Works:
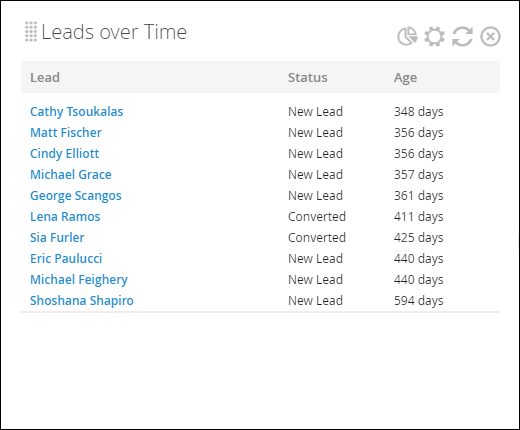
The Leads over Time card shows you the most recent ten leads in your database, including their first and last name, status, and age (e.g., how many days ago their record had a status change).
The Graph View displays a line graph where the horizontal is time, and vertical is the number of leads added. To change the intervals on the horizontal axis, click Day, Week, or Month where it says “Graphing data by.”
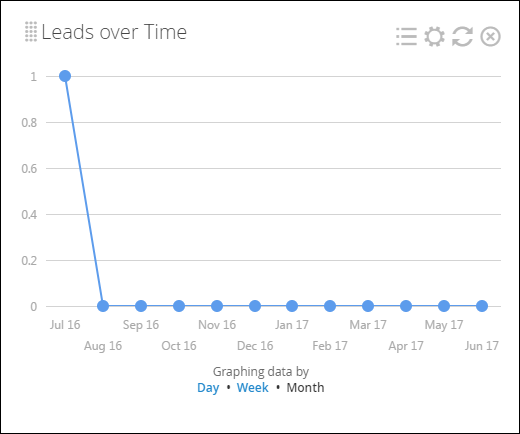
Clicking the gear icon will allow you to filter by My Leads, All Leads, User, or Department, as well as by Date Added or Status.