Opportunity Dashboard Cards
This article contains a list of all available Dashboard cards for Opportunities. For more information about the Opportunity Dashboard, see Understanding the Opportunity Dashboard.
You can add individual cards to your dashboard via the Add Card drop-down in the upper-right corner of the page, then drag and drop the cards into your desired order. Some cards allow you to add multiple copies, for use cases such as:
- I'm a manager and I would like to see one card for each of my team members.
- I want to add cards for both this year and last year to compare.
List of Opportunity Dashboard Cards
- Opportunities by Lead Source Dashboard Card
- Opportunities by Status Dashboard Card
- Opportunities by Department Dashboard Card
- Opportunities Added Dashboard Card
- Opportunities by Reason Closed Dashboard Card
- Opportunities by Owner Dashboard Card
- Opportunities by Company Dashboard Card
- Opportunities by Business Sector Dashboard Card
- Opportunities by Category Dashboard Card
- Opportunities Requiring Action Dashboard Card
- Opportunities at a Glance Dashboard Card
- Win Rate Dashboard Card
- Pipeline Velocity Dashboard Card
- Opportunity Aging Dashboard Card
- Snapshot Dashboard Card
- Sales Performance Card
Opportunities by Lead Source Dashboard Card
- Location: Opportunity Dashboard and My Dashboards
-
Allows for Multiple Copies? Yes
How it Works:
The Opportunities by Lead Source card shows you all of the opportunities that were generated when a lead was converted to a contact, broken down by lead source, with their combined deal value and weighted deal value.
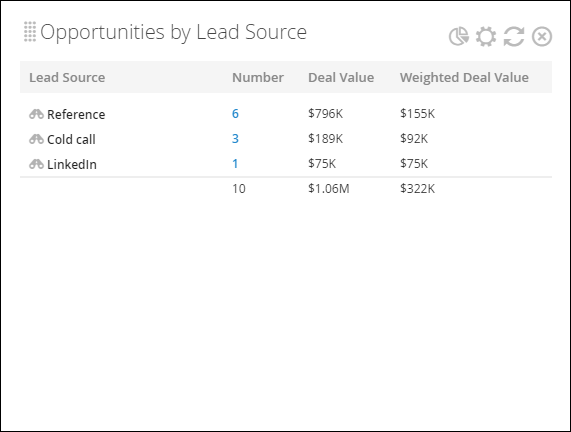
If the original lead did not have a lead source, then the opportunity will not display on this card.
The Graph View shows you a pie chart of the combined Deal Value or Weighted Deal Value per source.
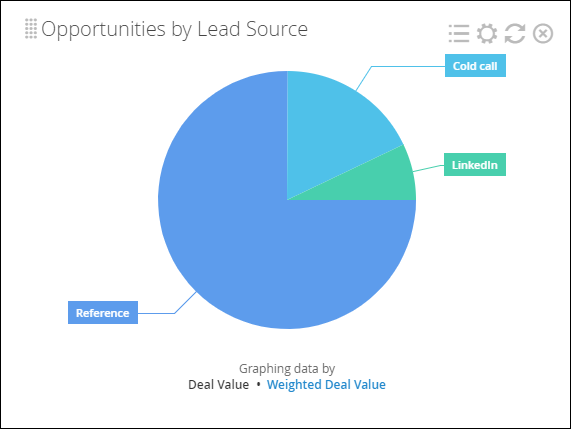
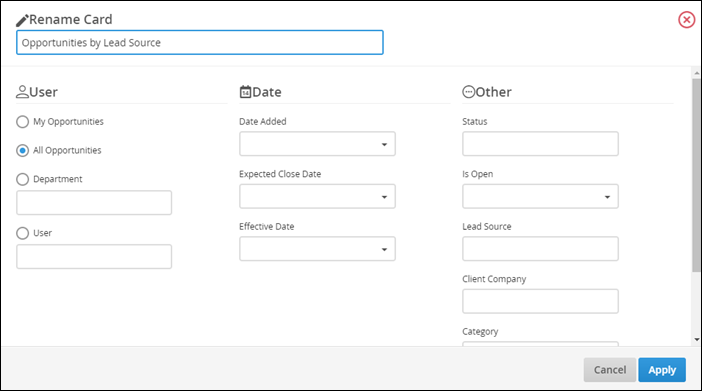
Clicking on the gear icon allows you to filter this card based on My Opportunities, All Opportunities, Department, User, Date Added, Expected Close Date, Effective Date, Status, Is Open, Lead Source, Client Company, Category or Business Sector.
Opportunities by Status Dashboard Card
- Location: Opportunity Dashboard and My Dashboards
-
Allows for Multiple Copies? Yes
How it Works:
The Opportunities by Status card shows you opportunities divided by their current status, providing the total number of opportunities in each status, with their combined deal value and weighted deal value.
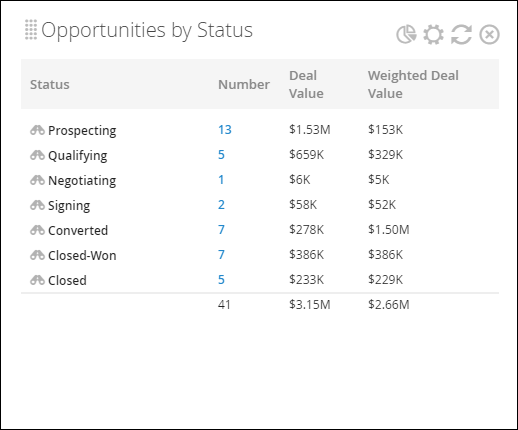
The Graph View shows you the percentage of opportunities by status. You can toggle the "Graphing data by" section to choose whether to view it by Deal Value or Weighted Deal Value.
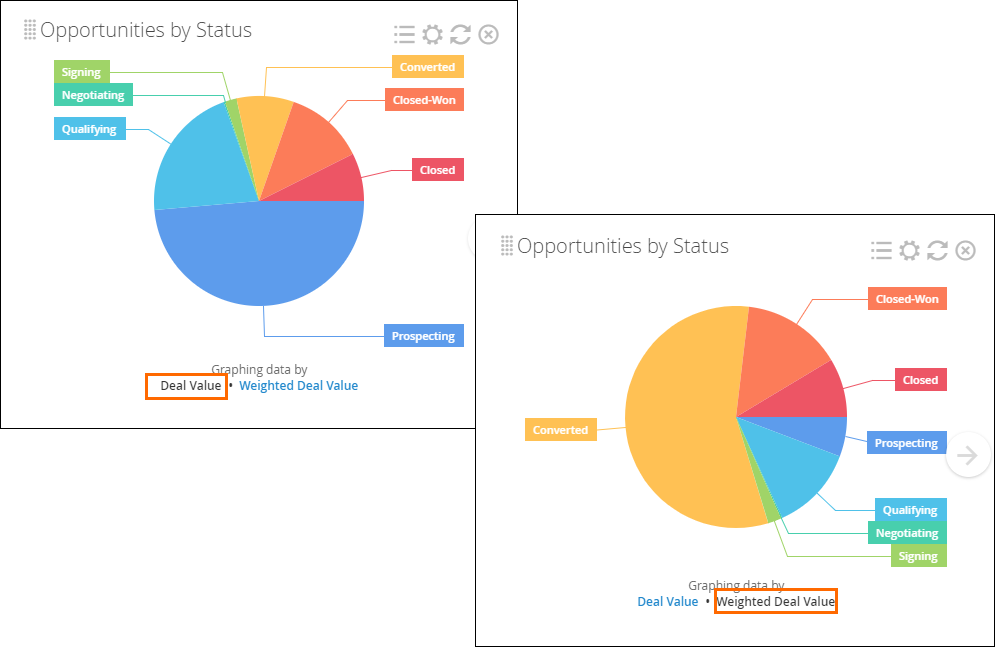
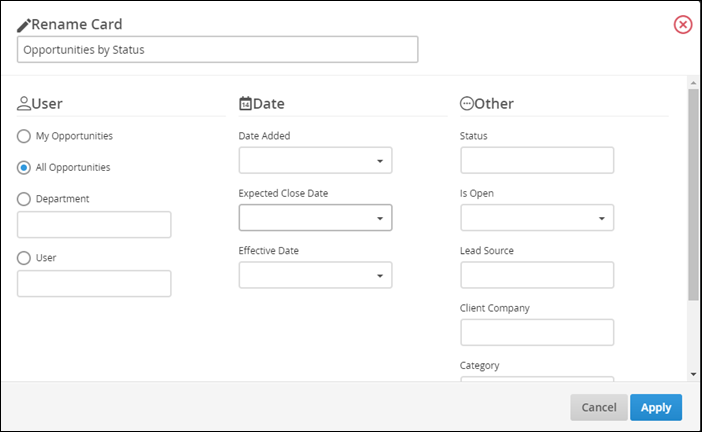
Clicking the gear icon will allow you to filter by My Opportunities, All Opportunties, User, or Department, as well as by Date Added, Expected Close Date, Effective Date, Status, Is Open, Lead Source, Client Company, Category or Business Sector.
Opportunities by Department Dashboard Card
- Location: Opportunity Dashboard and My Dashboards
-
Allows for Multiple Copies? Yes
How it Works:
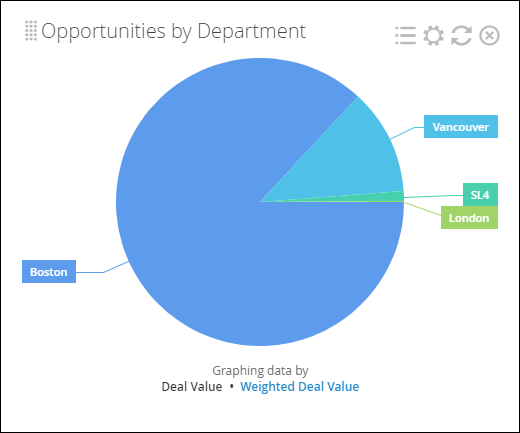
The Opportunities by Department card shows you opportunities divided by the department associated with their owner, providing the total number of each, with their combined deal value and weighted deal value.
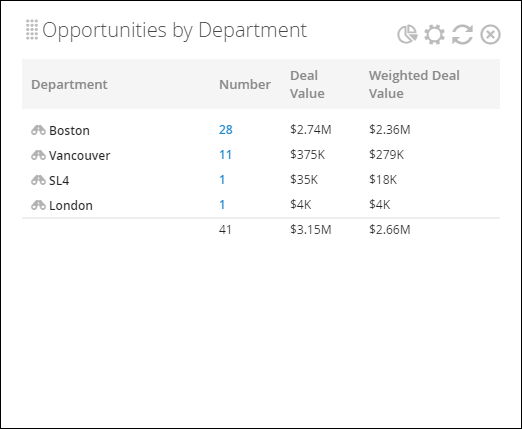
The Graph View shows you a pie chart of the combined Deal Value or Weighted Deal Value per department.
Clicking the gear icon will allow you to filter by My Opportunities, All Opportunities, User, or Department, as well as by Date Added, Expected Close Date, Effective Date, Status, Is Open, Lead Source, Client Company, Category, or Business Sector.

Opportunities Added Dashboard Card
- Location: Opportunity Dashboard and My Dashboards
-
Allows for Multiple Copies? Yes
How it Works:
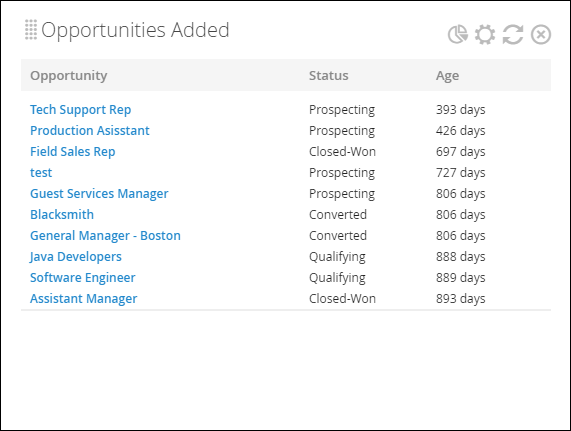
The Opportunities Added card shows you all opportunities in your database, including the title, status, and age (e.g., how many days ago the record had a status change).
If you have yet to add any opportunity records, this card will remain blank.
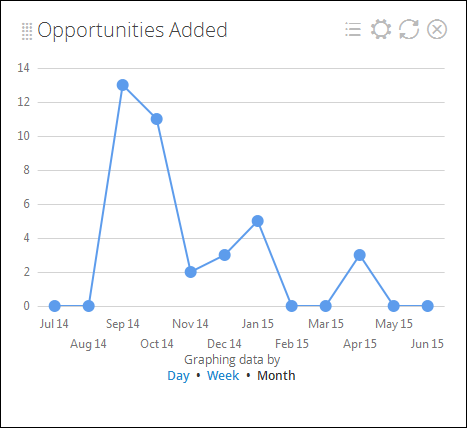
The Graph View shows you a line graph with the horizontal axis being the time range and the vertical axis being the number of opportunities added.
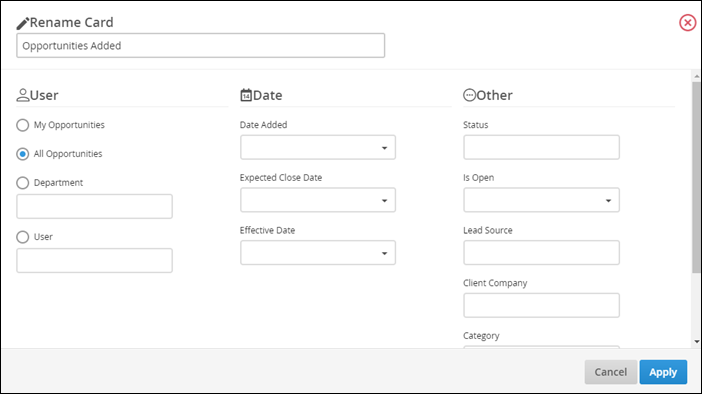
Clicking the gear icon will allow you to filter by My Opportunities, All Opportunities, User, or Department, as well as by Date Added, Expected Close Date, Effective Date, Status, Is Open, Lead Source, Client Company, Category or Business Sector.
Opportunities by Reason Closed Dashboard Card
- Location: Opportunity Dashboard and My Dashboards
-
Allows for Multiple Copies? Yes
How it Works:
The Opportunities by Reason Closed card shows you all opportunities divided by their reason closed, providing the total number of opportunities with each reason, with their combined deal value and weighted deal value.
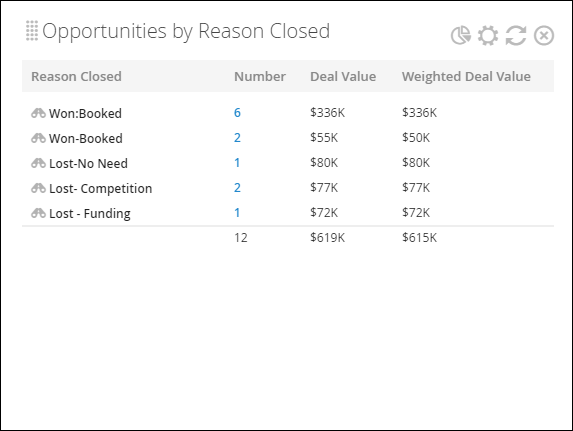
The Graph View shows you a pie chart of either the combined Deal Value or Weighted Deal Value per reason closed.
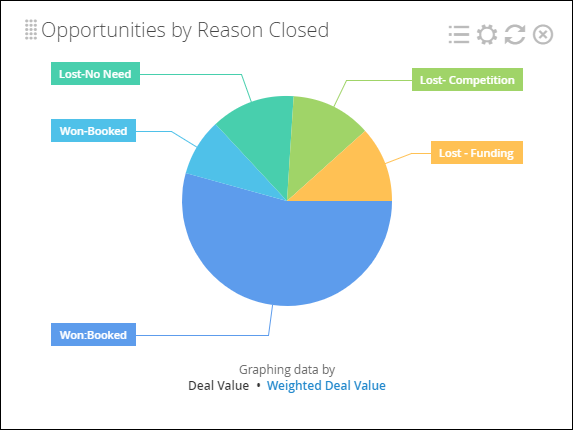
Clicking on the gear icon allows you to filter this card by My Opportunities, All Opportunities, Department, User, Date Added, Expected Close Date, Effective Date, Status, Is Open, Lead Source, Client Company, Category or Business Sector.

Opportunities by Owner Dashboard Card
- Location: Opportunity Dashboard and My Dashboards
-
Allows for Multiple Copies? Yes
How it Works:
The Opportunities by Owner card shows you all of the Bullhorn users who own opportunities, providing the total number of opportunities each of them own, with their combined deal value and weighted deal value.
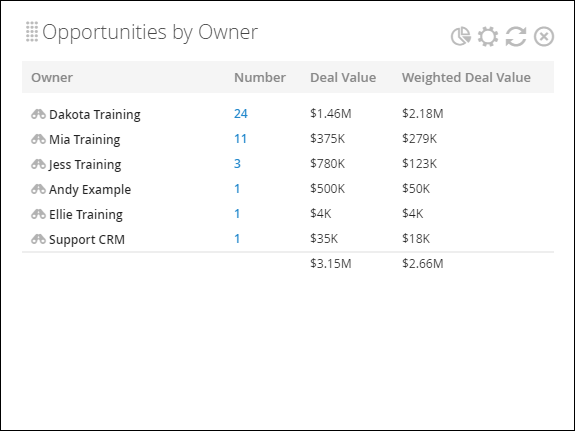
The Graph View shows you a pie chart of the combined Deal Value or Weighted Deal Value per owner.
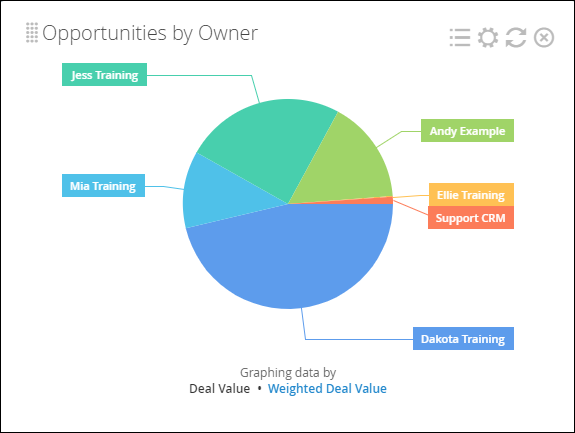
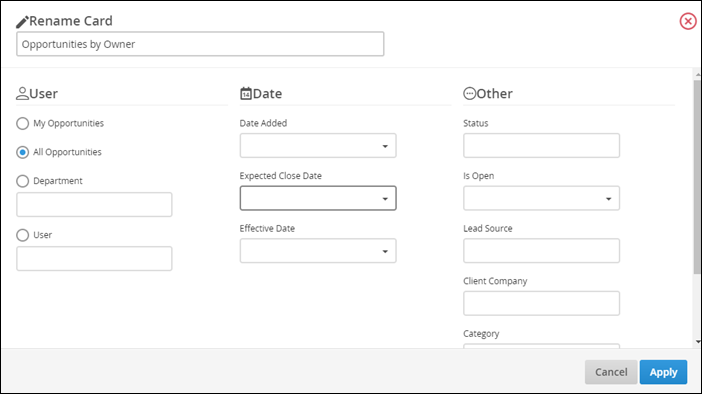
Clicking on the gear icon allows you to filter this card based on My Opportunities, All Opportunities, Department, User, Date Added, Expected Close Date, Effective Date, Status, Is Open, Lead Source, Client Company, Category or Business Sector.
Opportunities by Company Dashboard Card
- Location: Opportunity Dashboard and My Dashboards
-
Allows for Multiple Copies? Yes
How it Works:
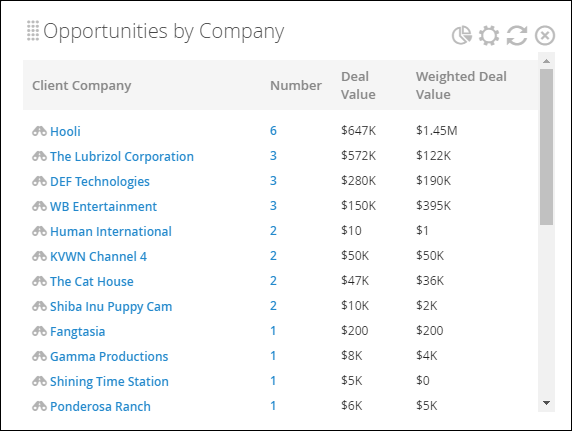
The Opportunities by Company card shows you the number of opportunities associated with companies in your database, and calculates the combined deal value and weighted deal value for each. Totals for the number, deal value, and weighted deal value columns are also displayed.
If a company has 0 opportunities associated with it, it will not be displayed.
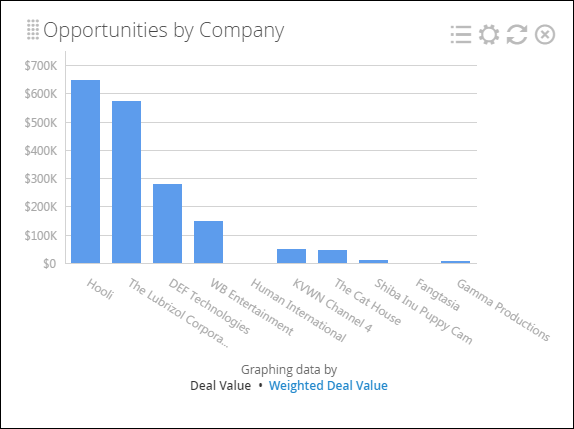
The Graph View shows you a bar chart where the combined Deal Value or Weighted Deal Value is on the vertical axis and each Company is on the horizontal axis. You can choose whether to view Deal Value or Weighted Deal Value by clicking the link in the "Graphing data by" section.
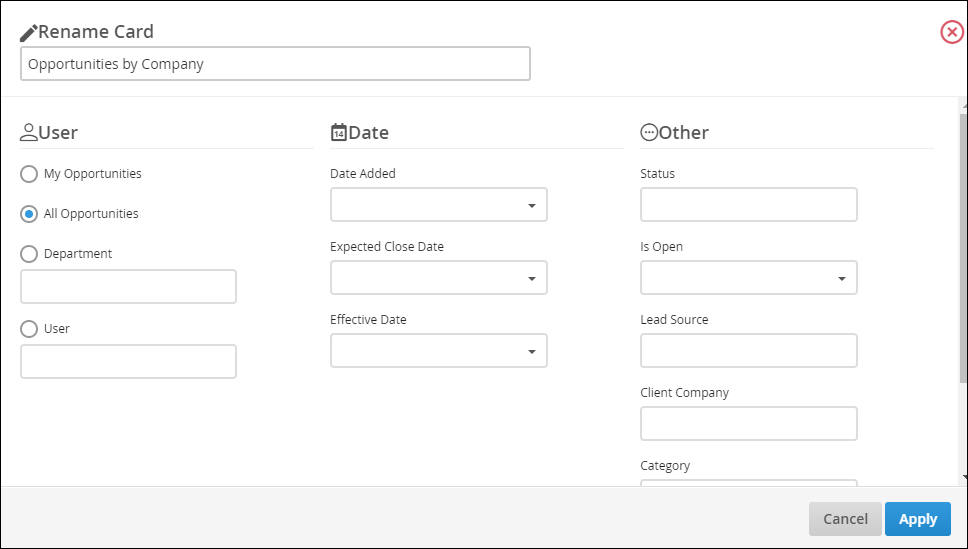
Clicking on the gear icon allows you to filter this card based on My Opportunities, All Opportunities, Department, User, Date Added, Expected Close Date, Effective Date, Status, Is Open, Lead Source, Client Company, Category or Business Sector.
Opportunities by Business Sector Dashboard Card
- Location: Opportunity Dashboard and My Dashboards
-
Allows for Multiple Copies? Yes
How it Works:
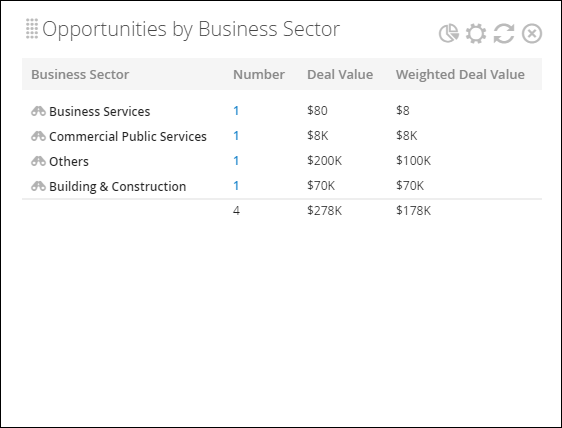
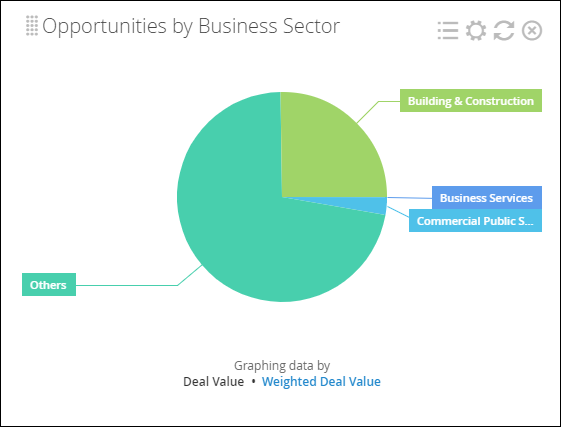
The Opportunities by Business Sector card shows you the number of opportunities associated with each sector of your business, and calculates the combined deal value and weighted deal value for each. Totals for the number, deal value, and weighted deal value columns are also displayed.
If a sector has 0 opportunities associated with it, it will not be displayed.
The Graph View shows you a pie chart of the combined Deal Value or Weighted Deal Value per Business Sector.
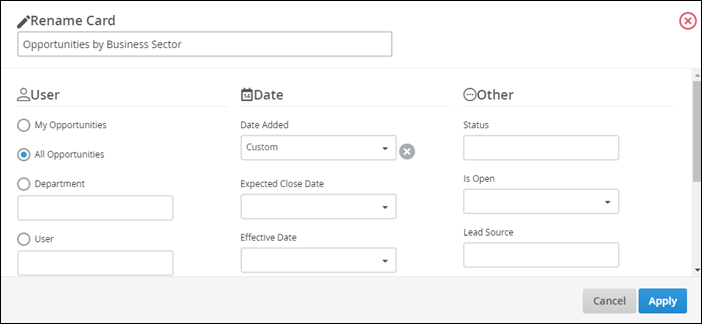
Clicking on the gear icon allows you to filter this card based on My Opportunities, All Opportunities, Department, User, Date Added, Expected Close Date, Effective Date, Status, Is Open, Lead Source, Client Company, Category or Business Sector.
Opportunities by Category Dashboard Card
- Location: Opportunity Dashboard and My Dashboards
-
Allows for Multiple Copies? Yes
How it Works:
The Opportunities by Category card shows you the number of opportunities associated with each category of your business, and calculates the combined deal value and weighted deal value for each. Totals for the number, deal value, and weighted deal value columns are also displayed.
If a category has 0 opportunities associated with it, it will not be displayed.
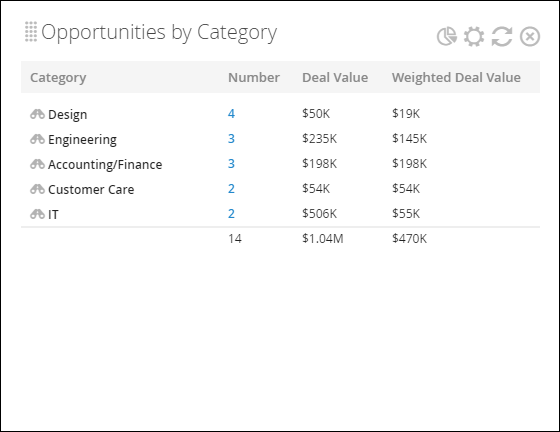
The Graph View shows you a pie chart of the combined Deal Value or Weighted Deal Value per category.
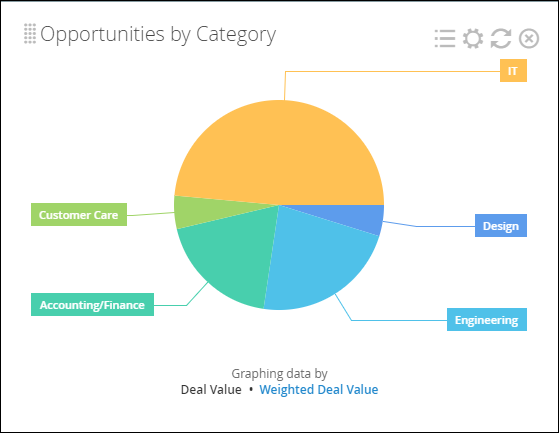
Clicking on the gear icon allows you to filter this card based on My Opportunities, All Opportunities, Department, User, Date Added, Expected Close Date, Effective Date, Status, Is Open, Lead Source, Client Company, Category or Business Sector.

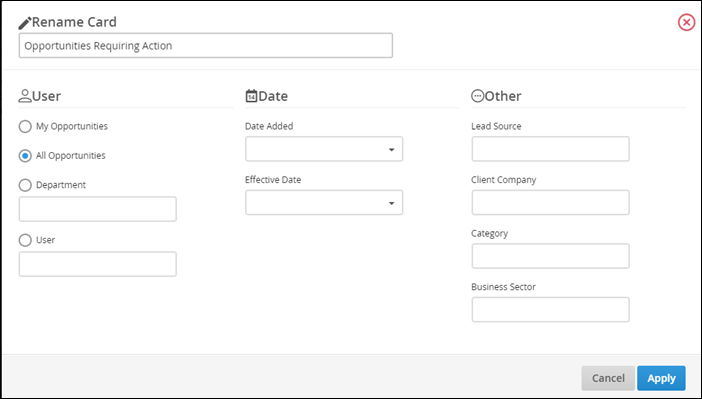
Opportunities Requiring Action Dashboard Card
- Location: Opportunity Dashboard and My Dashboards
-
Allows for Multiple Copies? Yes
How it Works:
The Opportunities Requiring Action card shows you a list of opportunities that are still open after their expected close date
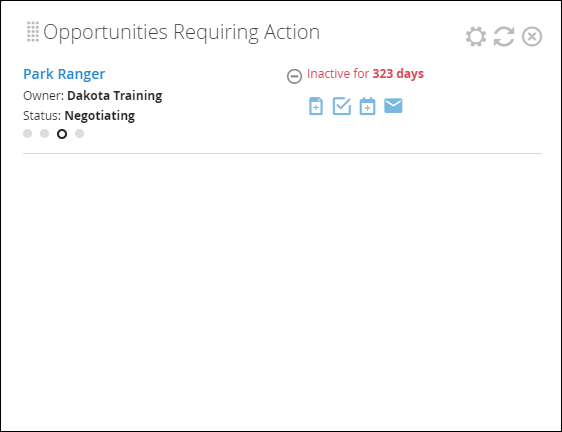
Clicking on the gear icon allows you to filter this card based on My Opportunities, All Opportunities, Department, User, Date Added, Effective Date, Lead Source, Client Company, Category or Business Sector.
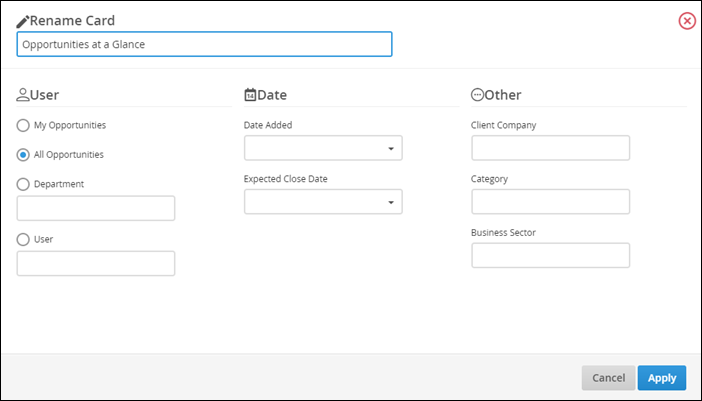
Opportunities at a Glance Dashboard Card
-
Location: Opportunity Dashboard and My Dashboards
-
Allows for Multiple Copies? Yes
How it Works:
The Opportunities at a Glance card shows you the total number of opportunities in your corporation, as well as the collective deal and weighted deal value for those that are active (i.e., not closed).
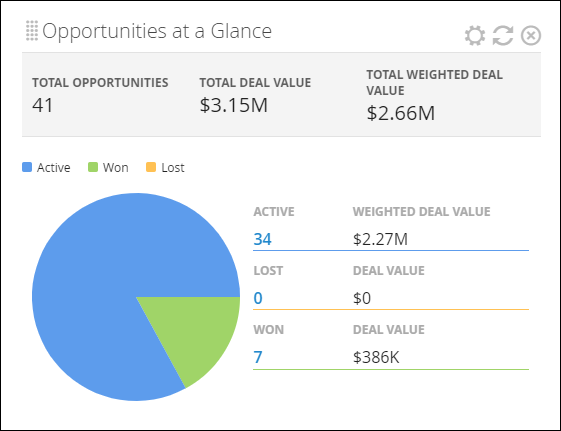
In this card:
- Total Opportunities = Total number of opportunity records in your corporation, regardless of status.
- Total Deal Value = Total deal value of opportunities that are either Active or Closed-Won.
- Total Weighted Deal Value = Total weighted deal value of opportunities that are in any status other than Closed-Lost or Closed.
- Active = any status other than Closed-Won, Closed-Lost, or Closed.
- Won = Closed-Won
- Lost = Closed-Lost
Clicking on the gear icon allows you to filter this card based on My Opportunities, All Opportunities, Department, User, Date Added, Expected Close Date, Client Company, Category or Business Sector.
Win Rate Dashboard Card
-
Location: Opportunity Dashboard and My Dashboards
-
Allows for Multiple Copies? Yes
How it Works:
The Win Rate card shows your overall opportunity win rate, and tracks it over time (either by week, month, or the entire year). Your win rate is calculated by dividing the number of opportunities (in the given timeframe) with a status of either Converted or Closed-Won by the number of opportunities with a status of either Converted, Closed-Won, or Closed-Lost.
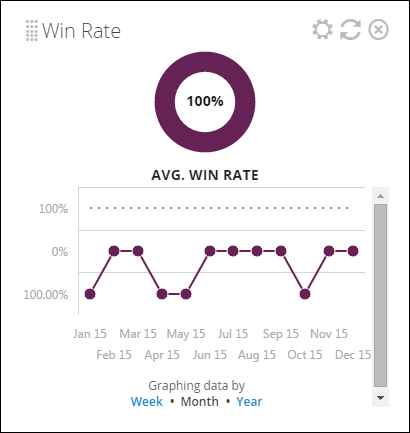
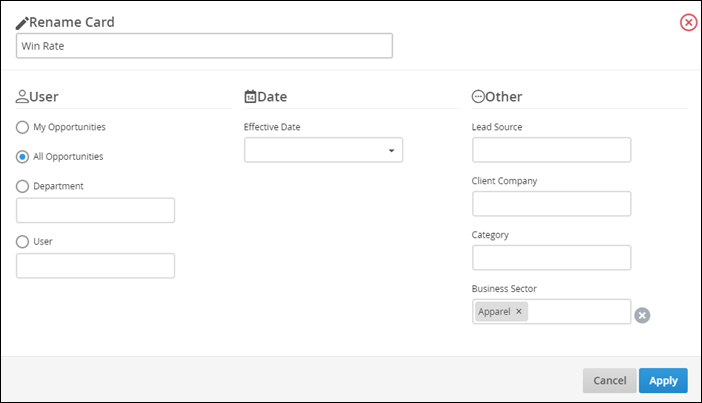
Clicking on the gear icon allows you to filter this card based on My Opportunities, All Opportunities, Department, User, Effective Date, Lead Source, Client Company, Category or Business Sector.
Pipeline Velocity Dashboard Card
-
Location: Opportunity Dashboard and My Dashboards
-
Allows for Multiple Copies? Yes
How it Works:
The Pipeline Velocity card enables you to track your opportunity velocity, status by status. Pick any two opportunity statuses from the drop-downs at the top, and the card will display how long, on average, it takes an opportunity to move from the first status to the second status, as well as what percentage of opportunities reach the second status.
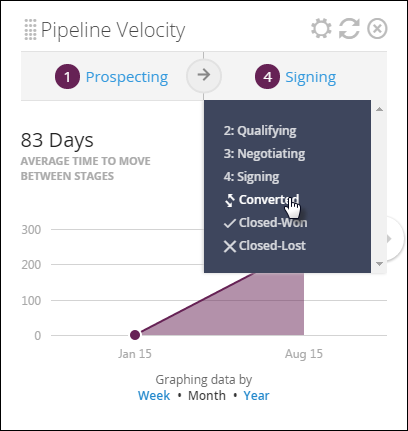
Clicking on the gear icon allows you to filter this card based on My Opportunities, All Opportunities, Department, User, Date Added, Expected Close Date, Effective Date, Is Open, Lead Source, Client Company, Category or Business Sector.

Opportunity Aging Dashboard Card
-
Location: Opportunity List Slideout
-
Allows for Multiple Copies? No
How it Works:
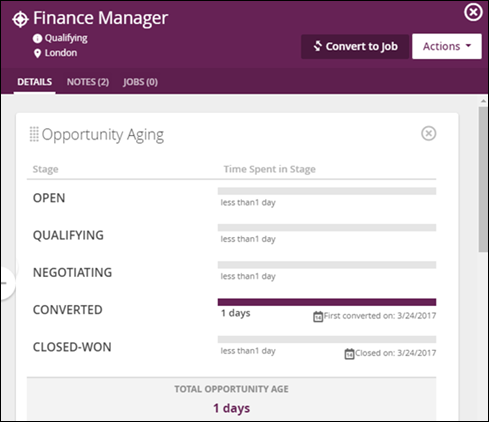
The Opportunity Aging card appears on the slide-out tab accessed via the Opportunity list view using the binoculars. This card captures the length an Opportunity has spent in each status and shows when a status change is made.
Snapshot Dashboard Card
-
Location: Opportunity List Slideout
-
Allows for Multiple Copies? No
How it Works:
The Snapshot card appears on the slide-out tab accessed via the Opportunity list view using the binoculars. This card displays information pertaining to the Opportunity that is accessed using the slide-out.
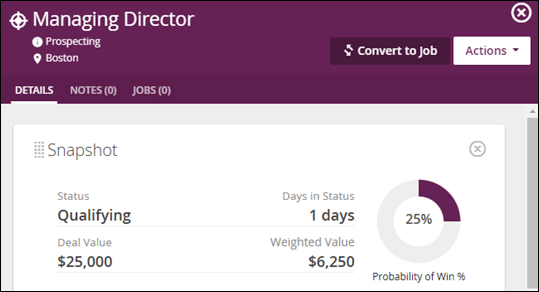
- Probability of Win % is controlled via the System Setting opportunityStatusProbabilityToClose. Additional information on this System Setting can be found in Understanding Bullhorn System Settings, within the Overview section.
- The Weighted Deal Value is calculated by multiplying the Deal Value by the Probability of Win %.
Sales Performance Dashboard Card
How it Works:
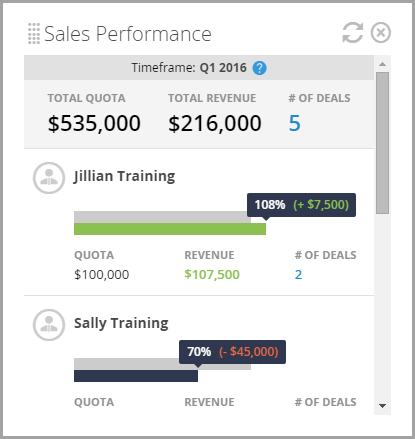
This card acts as a leaderboard and displays the following:
- Total quota for the current quarter, total revenue for the current quarter, and the total number of deals (opportunities) with the statuses selected on the Goals and Quotas Configuration page for the entire company.
- Total quota for the current quarter, total revenue for the current quarter, and the total number of deals (opportunities) with the statuses selected on the Goals and Quotas Configuration page for the top 25 performing users (sorted from highest to lowest).