| Edition: Enterprise | Audience: All Users |
Manager's Toolkit: Perm Sales by Consultant
The Perm Sales by Consultant report shows the total of Perm Sales for the last 12 months. It is broken down by month for each consultant.
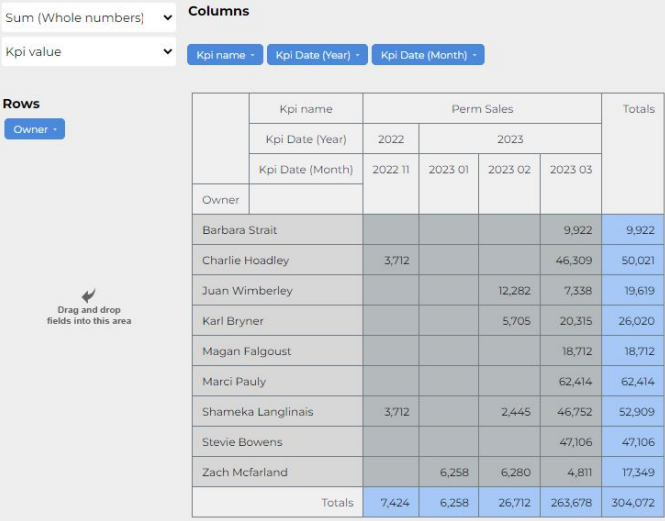
This report is part of the Slice & Dice Manager's Toolkit.
Key Questions This Report Helps Answer
- How effective and consistent are our perm consultants?
- Who is the top perm biller each month?
- How quickly are new consultants generating an ROI?
- Which consultants are in need of help and support to improve billing consistency?
Tips
- The report is heatmapped by column to identify the top performers in each month:
- The dropdown is located to the left of the main array of blue variables.
- Switch to Row Heatmap to easily identify a consultant's best month.
- Data is presented in a Table by default, but you can also use the Bar Chart or Stacked Bar Chart options.
- With heat maps, the darker the red color, the higher the value.
- Try pulling Organization into Rows to see a consultant's suite of billing clients.
Was this helpful?