Adding Multiple Charts to One Workspace
In Bullhorn Reporting, the best option for displaying multiple charts or graphs at one time on a report is to show them on the same page, similar to a dashboard.
Steps
You can use the Page Layout to accomplish this task.
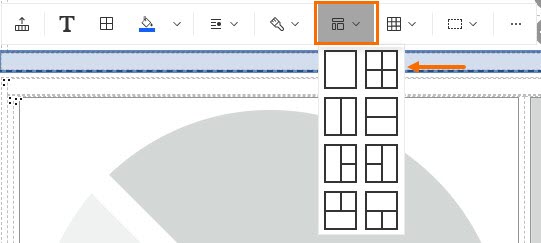
- With a new report open, select the Page Layout button.
- Choose the 2x2 square option.
- This option allows you to add four separate charts or graphs to your workspace. There are other options, so select the one that applies best for you. If you need more than 4 sections, use a table instead.
- This option allows you to add four separate charts or graphs to your workspace. There are other options, so select the one that applies best for you. If you need more than 4 sections, use a table instead.
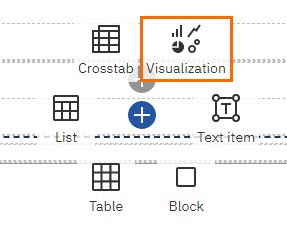
- Click the Plus button in the newly created section.
- New menu choices will appear. Select Visualizations to add a chart or graph to the section.
- See the following articles for more information on creating charts and graphs: Creating Pie Charts in Bullhorn Reporting (Previously Canvas) and Creating Bar Graphs in Bullhorn Reporting (Previously Canvas).
- See the following articles for more information on creating charts and graphs: Creating Pie Charts in Bullhorn Reporting (Previously Canvas) and Creating Bar Graphs in Bullhorn Reporting (Previously Canvas).
- Repeat until you've added all desired charts and graphs.
Was this helpful?