Changing the Color of Graph Lines in Bullhorn Reporting (Previously Canvas)
The color palette of the graph controls the colors applied and the order of the series determines the color that is applied.
Steps
- Click More > Modify Report.
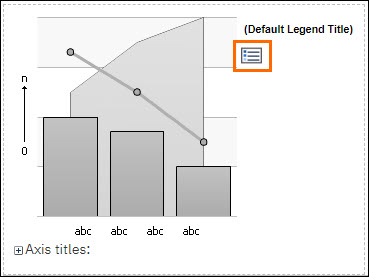
- Under Default Legend Title, click on the note card graphic.
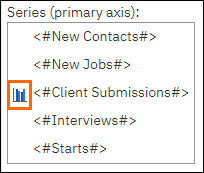
- In the Series (primary axis) box, click on the graph icon.
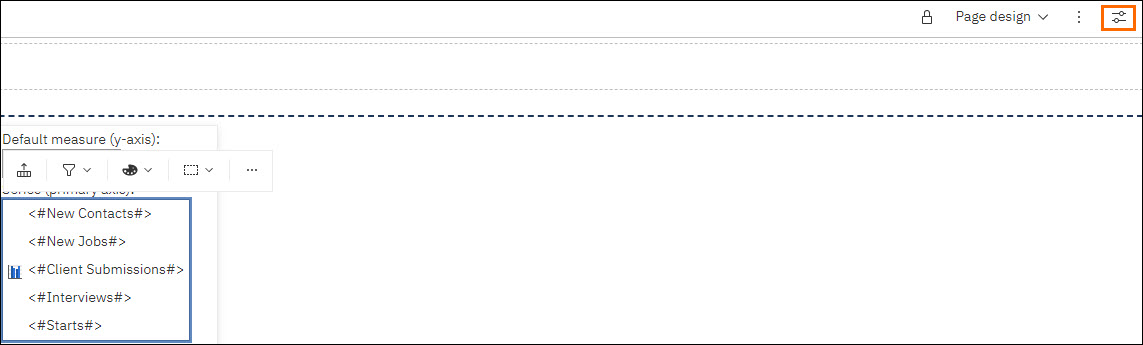
- Click on the Show properties icon.
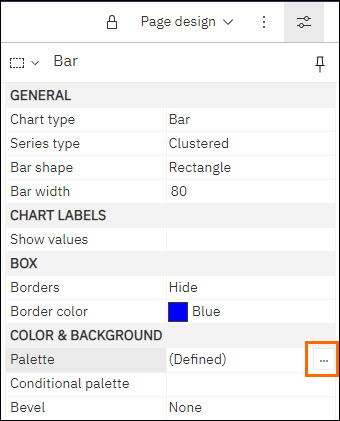
- In the Properties pane click on Palette to bring up an ellipse, indicating more options. Click this new button.
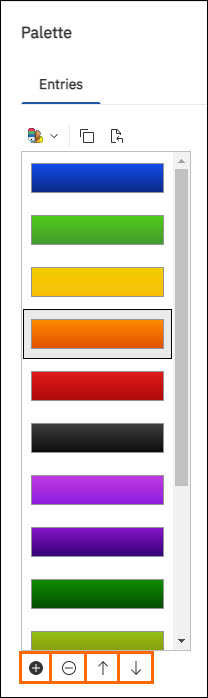
- This pane will show you the colors used and in what order.
- To change the color order, click on a color and then use the Move Up or Move Down arrows as desired.
- You may also add colors by clicking New, which is represented by a plus sign.
- You may also delete colors by clicking Delete, which is represented by a minus sign.
- To change a specific color, click on that color and in the Fill section, select the Fill type Color.
- Click on the color box beneath the drop-down.
- You may elect to keep the Fill type as a Linear Gradient. If so, be sure to edit both color boxes.
- From this screen you can choose:
- A Basic color.
- A shade from your Color swatch.
- Or input/create a Custom color.
- A Basic color.
- Make your desired selection and click OK > OK to return to the Modify Report screen.
Was this helpful?