Conditional Formatting in Bullhorn Reporting (Previously Canvas)
Conditional styles allow you to apply styles to data within your Bullhorn Reporting report based off of your desired criteria. You can apply conditional formatting to data in order to highlight specific trends within the data that you are reporting on. This article covers how to add conditional styles to your Bullhorn Reporting reports.
Adding Conditional Styles
In this example, we add a conditional style to a report that shows the total number of Submissions by Candidate Owner. We want to highlight cells green where candidate owners have made more than 20 submissions.
Steps
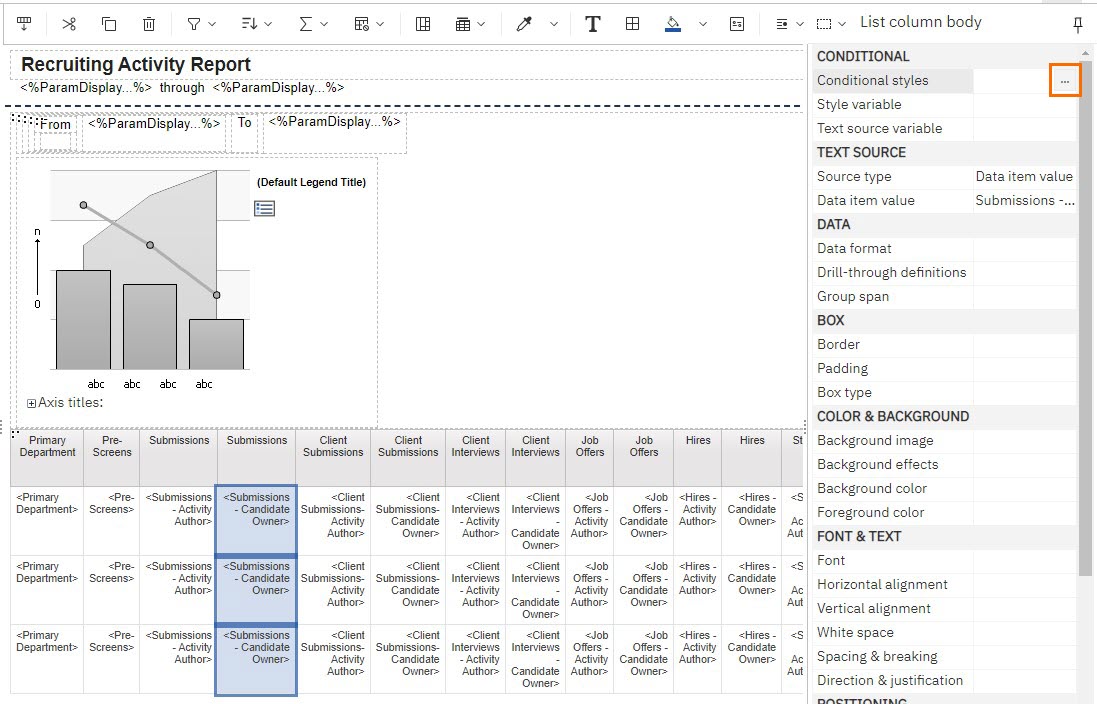
- In Bullhorn Reporting, select a data item within your report.
- Select the three dots next to Conditional styles in the right side pane. The Conditional Styles screen will open.
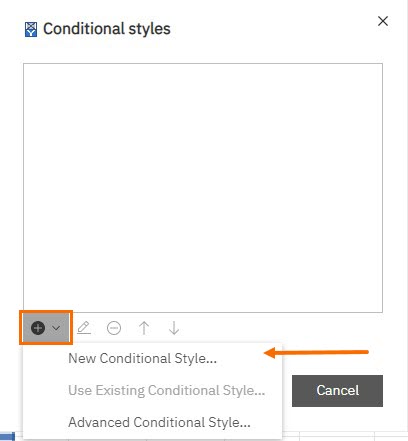
- Select the plus icon and choose New Conditional Style...
- If you are unable to select New Conditional Style... ensure that you followed step one and selected a data item.
- If you are unable to select New Conditional Style... ensure that you followed step one and selected a data item.
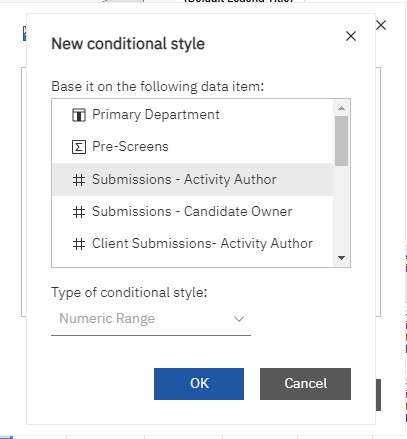
- Select the desired data item and click OK. The next window allows you to customize styles in your report based off your desired criteria.
- Select the plus icon to add a new value.
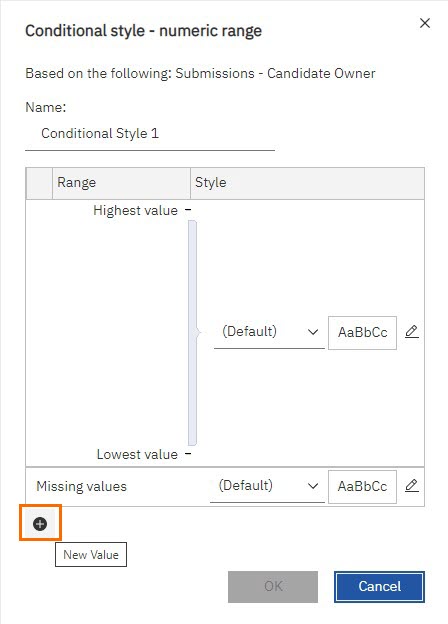
- Enter a value and click OK.
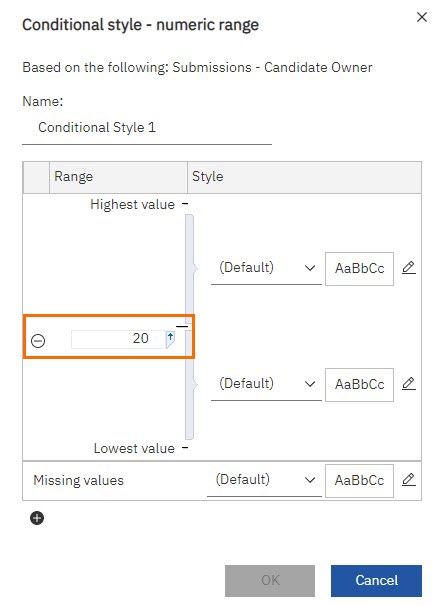
- The value that you enter will appear in the range section on the Conditional Style window.
- Use the arrow next to the value to change the data display for anything less than or greater than the value you entered.
- In this example we want cells to appear green where candidate owners have more than 20 submissions.
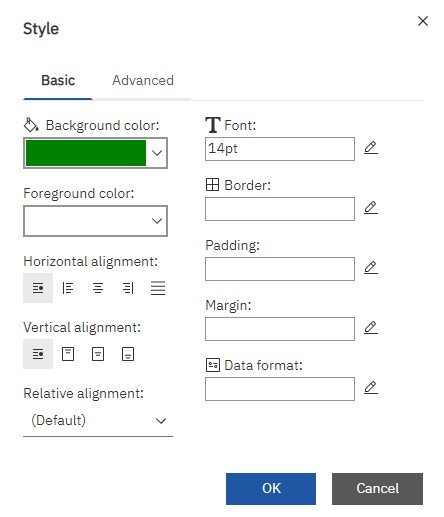
- Select the pencil icon in the Style column to open the Style window. This allows you to customize your conditional style.
- Select OK when you are finished.
- Select OK to save the conditional style you created.
- Click OK again to close the Conditional Styles menu.
You can add additional conditional styles to your report if desired. Run your report to see the applied styles display.
Related Articles
Was this helpful?