Creating Pie Charts in Bullhorn Reporting (Previously Canvas)
This article covers how to create Pie Charts in Bullhorn Reporting.
Steps
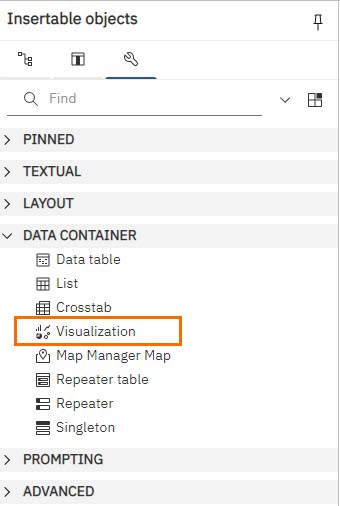
- From the Insertable objects panel, double-click Visualization.
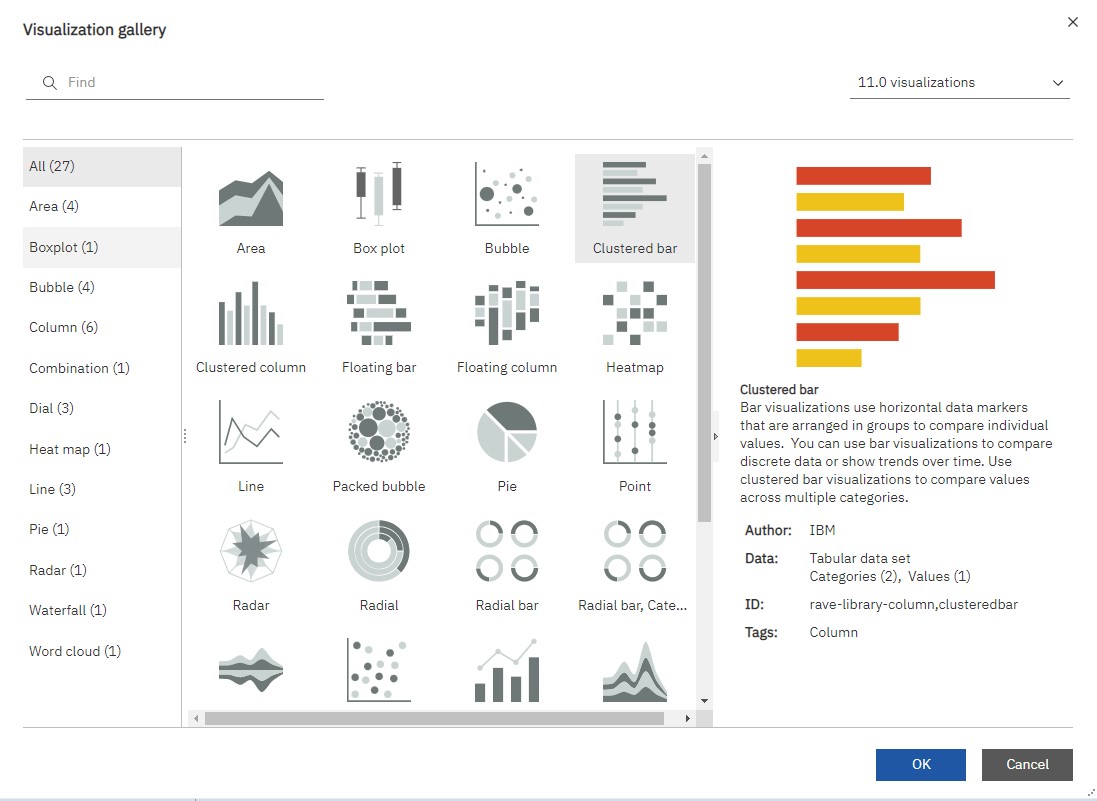
- Select the desired chart type.
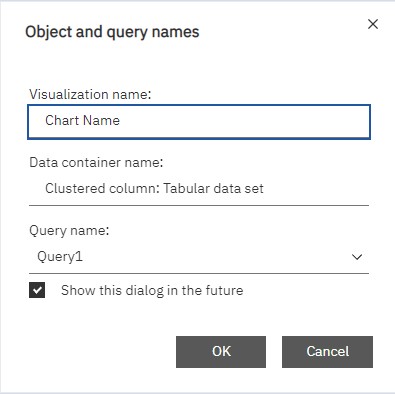
- Input your chart's Name and create a new Query name.
- From the Source panel, drag the desired data item onto Default Measure on the pie chart.
- Example: Candidate Count.
- Drag the desired data item you'd like to see as a pie slice onto Series (pie slices).
- Example: Candidate Source.
Now you can apply any applicable filters to your report and update your charts colors. If you'd like to show multiple charts on a single report page, seeAdding Multiple Charts to One Workspace.
Was this helpful?