Modifying How Data is Displayed in Bullhorn Reporting (Previously Canvas)
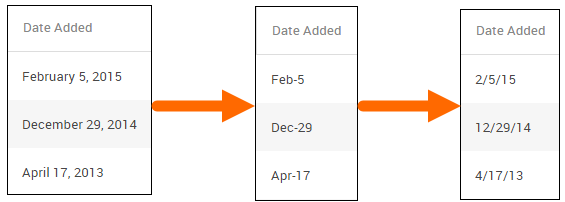
You may want to format the way data displays when your report is ran as you continue to build out reports using Bullhorn Reporting. For example, if your report includes a date column, you can format the data in that column to display the date in a variety of ways. This article walks you through how to modify the data displayed on your reports in Bullhorn Reporting.
Types of Data
You can change the display for the following types of information:
- Currency
- Custom
- Date
- Date/Time
- Number
- Percentage
- Text
- Time
- Time/Interval
Steps
Make sure you have data items included in the Canvas Studio workspace before you begin.
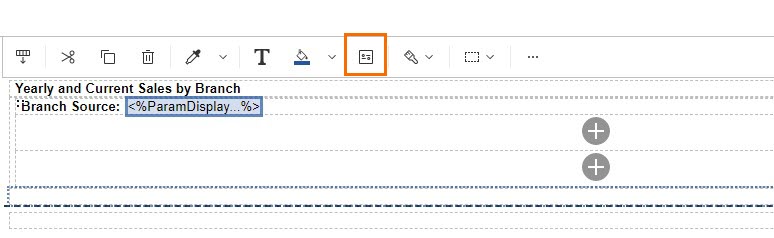
- Click on the contents of the column you want to change the data display on.
- The data display will only change for the data that you select in this step. If your report includes two date columns, you will need to perform the following steps for each column in order to get the format to change on both.
- Select the Data Format icon to open the Data Format window.
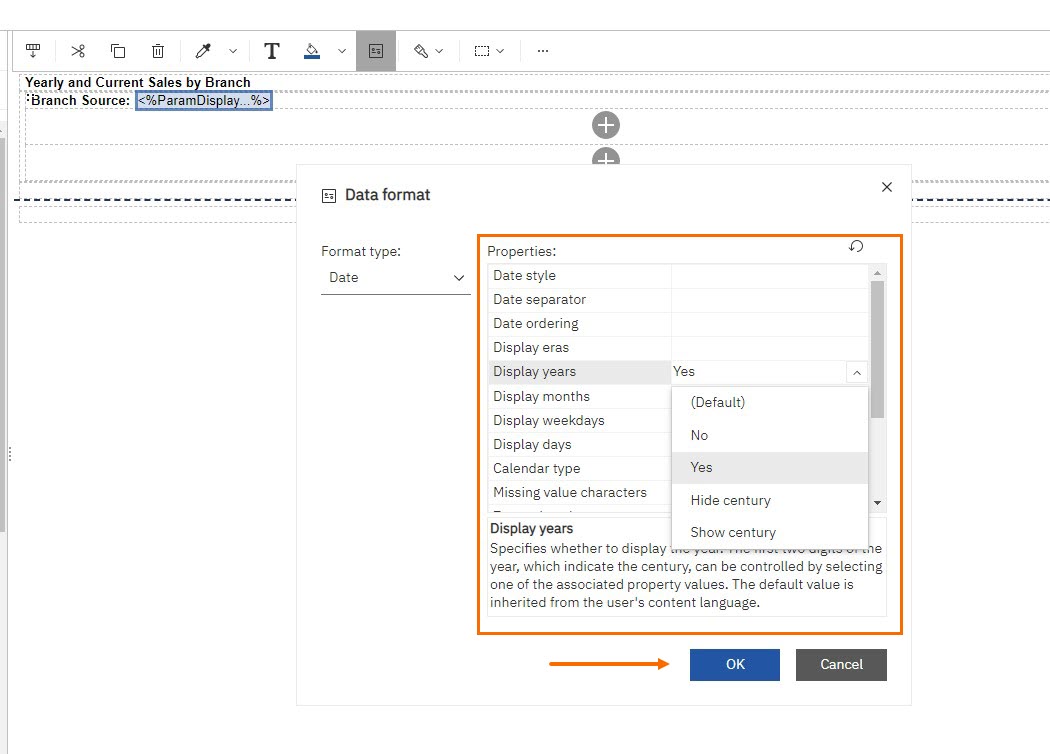
- Choose a Format Type based off of the information in the field you selected in Step 1.
- Use the Properties section to adjust the properties associated with the selected format type.
- When you are finished select OK.
You successfully changed the way data is displayed in your report. Changes made to the data format will appear the next time you run the report.
Related Articles
Was this helpful?