Changing a Chart Type in Bullhorn Reporting (Previously Canvas)
Let’s say you have a line graph, but realized perhaps a bar graph is more appropriate for your report. You can change the chart at any time.
How To
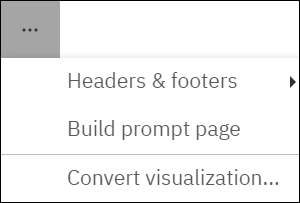
- Click on the cart and click the three dots in your toolbar. Then select Convert Visualization.
- Select the type of chart on the left pane and click on the style for that chart in the middle pane.
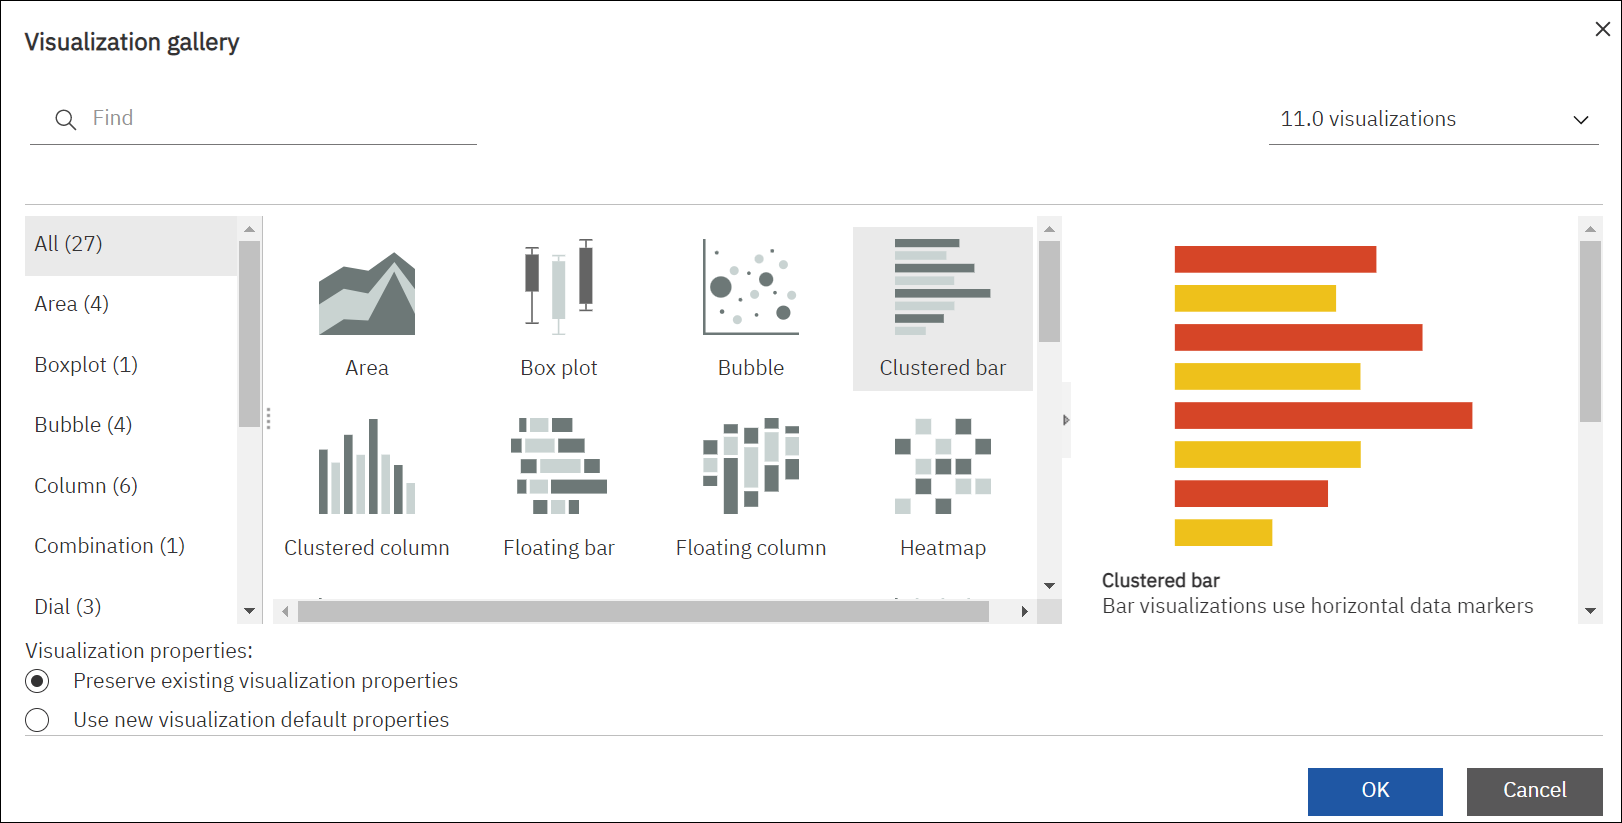
- Click OK.
Was this helpful?