Building a Report in Bullhorn Reporting (Previously Canvas)
The Canvas Studio is the working space of Bullhorn Reporting that you'll use to build your various reports. Each section of the Canvas Studio is explained in this article.
Navigating the Canvas Studio
The Canvas Studio is divided into the sections listed below. If you are curious about the actions of each button, mouse over the button for a description:
Each analysis package contains sub-sections that allow you to select various fields to report on. As you build your report, ensure that you are only using data items from one analysis package per report.
Taskbar
The taskbar contains options to save, undo, redo, and run the report.
Toolbar
The toolbar contains actions for the function you're currently working on. The options in the toolbar will change depending on the data item you have selected. 
Insertable Objects Panel
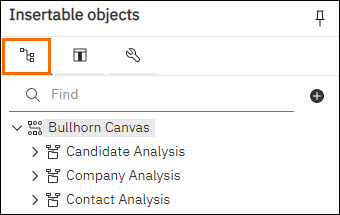
The Insertable Objects panel on the left side of the screen contains items you can add to your reports. It is split into three tabs:
- Sources Tab: Contains the fields from Bullhorn that you can report on, divided by entity.
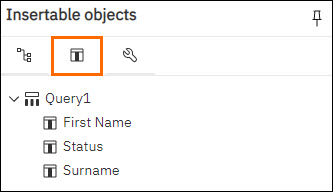
- Data Items Tab: Contains the data items included in your report.
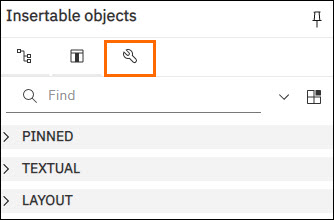
- Toolbox Tab: Contains the different reporting objects that you use to build your report, such as charts, lists, and tables.
Properties Panel
The Properties panel is used to define different reporting qualities such as the font, color, and conditional styles. You can show or hide this panel by clicking the  icon in the top right corner.
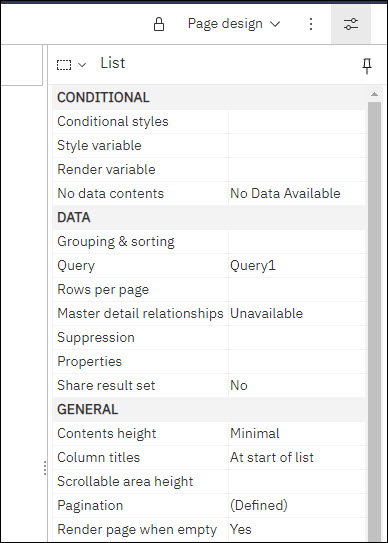
The Canvas
This is the space you will use to build out your Bullhorn Reportingreports.
Related